Technical Analysis of SUSL 2024-05-10
Overview:
In analyzing the technical indicators for SUSL over the last 5 days, we will delve into the trend, momentum, volatility, and volume indicators to provide a comprehensive outlook on the possible stock price movement in the coming days.
Trend Analysis:
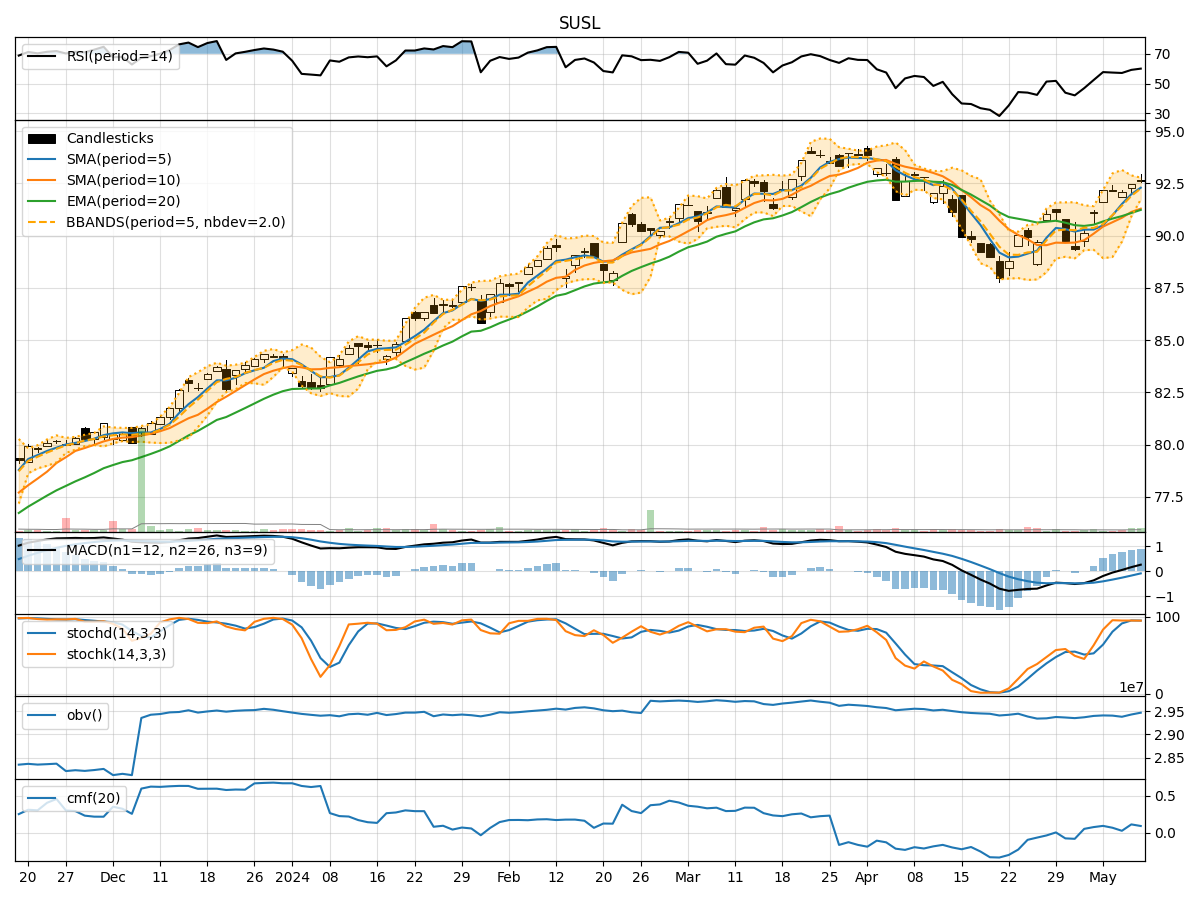
- Moving Averages (MA): The 5-day Moving Average (MA) has been consistently rising, indicating a bullish trend.
- MACD: The MACD line has been above the signal line for the past 5 days, suggesting a bullish momentum.
- RSI: The Relative Strength Index (RSI) has been in the neutral to overbought territory, reflecting positive momentum.
Momentum Analysis:
- Stochastic Oscillator: The Stochastic Oscillator has been in the overbought zone, signaling a strong bullish momentum.
- Williams %R: The Williams %R indicator has been fluctuating around the oversold territory, indicating potential buying opportunities.
Volatility Analysis:
- Bollinger Bands: The Bollinger Bands have been narrowing, suggesting decreasing volatility and a possible consolidation phase.
- Average True Range (ATR): The ATR has been relatively stable, indicating consistent price movements.
Volume Analysis:
- On-Balance Volume (OBV): The OBV has shown mixed signals with some days of distribution and accumulation, reflecting indecision in the market.
- Chaikin Money Flow (CMF): The CMF has been positive, indicating buying pressure in the stock.
Key Observations:
- The trend indicators suggest a strong bullish sentiment in the stock.
- Momentum indicators point towards a continuation of the bullish momentum.
- Volatility indicators indicate a potential consolidation phase.
- Volume indicators show mixed signals with a slight bias towards buying pressure.
Conclusion:
Based on the analysis of the technical indicators, the stock is likely to continue its upward movement in the coming days. The bullish trend, supported by positive momentum and volume, indicates a favorable outlook for SUSL. However, the narrowing Bollinger Bands suggest a possible consolidation phase before another leg up. Traders should consider buying on dips and setting appropriate stop-loss levels to manage risk effectively. Overall, the outlook for SUSL remains bullish in the short term.