Technical Analysis of SVAL 2024-05-10
Overview:
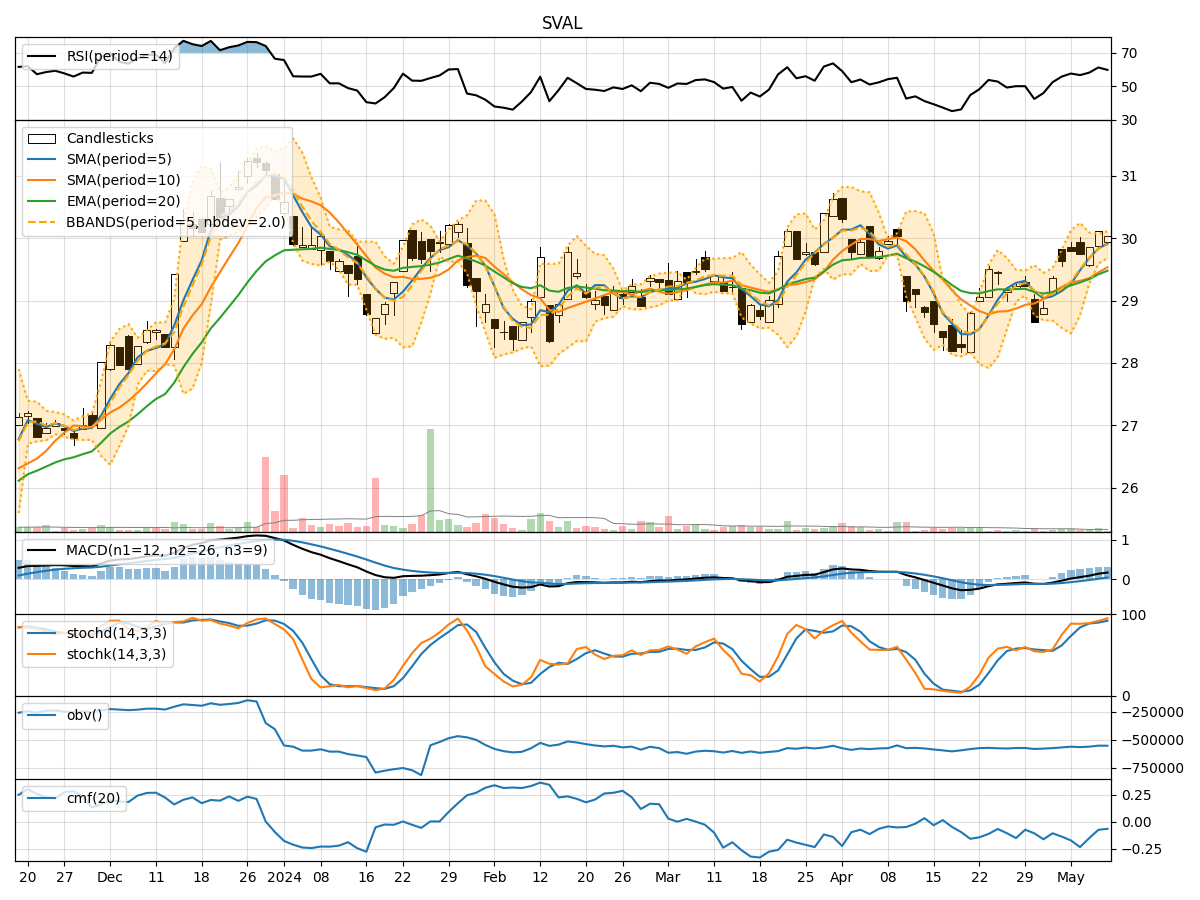
In analyzing the technical indicators for SVAL stock over the last 5 days, we will delve into the trend, momentum, volatility, and volume indicators to provide a comprehensive outlook on the possible stock price movement in the coming days.
Trend Analysis:
- Moving Averages (MA): The 5-day Moving Average (MA) has been trending upwards, indicating a positive momentum in the stock price.
- MACD: The MACD line has been consistently above the signal line, suggesting a bullish trend.
- RSI: The Relative Strength Index (RSI) has been fluctuating around the 60-70 range, indicating a neutral to slightly bullish sentiment.
Momentum Analysis:
- Stochastic Oscillator: The Stochastic Oscillator is in the overbought zone, suggesting a potential reversal or consolidation in the stock price.
- Williams %R: The Williams %R is in the oversold territory, indicating a possible buying opportunity.
Volatility Analysis:
- Bollinger Bands: The Bollinger Bands are narrowing, indicating decreasing volatility and a potential breakout in the stock price.
- Average True Range (ATR): The ATR has been relatively stable, suggesting a consistent level of volatility in the stock.
Volume Analysis:
- On-Balance Volume (OBV): The OBV has been fluctuating, indicating mixed buying and selling pressure.
- Chaikin Money Flow (CMF): The CMF has been negative, suggesting a bearish sentiment in the stock.
Conclusion:
Based on the analysis of the technical indicators, the stock of SVAL is likely to experience sideways consolidation in the coming days. The trend indicators show a bullish bias, supported by the positive MACD and moving averages. However, the momentum indicators signal a potential reversal or consolidation, especially with the Stochastic Oscillator in the overbought zone. The volatility indicators point towards a potential breakout, while the volume indicators suggest mixed sentiment with a bearish bias.
Recommendation:
Considering the overall analysis, it is advisable to exercise caution in trading SVAL stock in the near term. Traders may consider waiting for a clearer signal or confirmation of a trend before taking significant positions. Keep a close watch on the Stochastic Oscillator for a potential reversal signal and monitor the Bollinger Bands for a breakout opportunity. Additionally, pay attention to any significant changes in volume to gauge market sentiment accurately.