Technical Analysis of SXQG 2024-05-10
Overview:
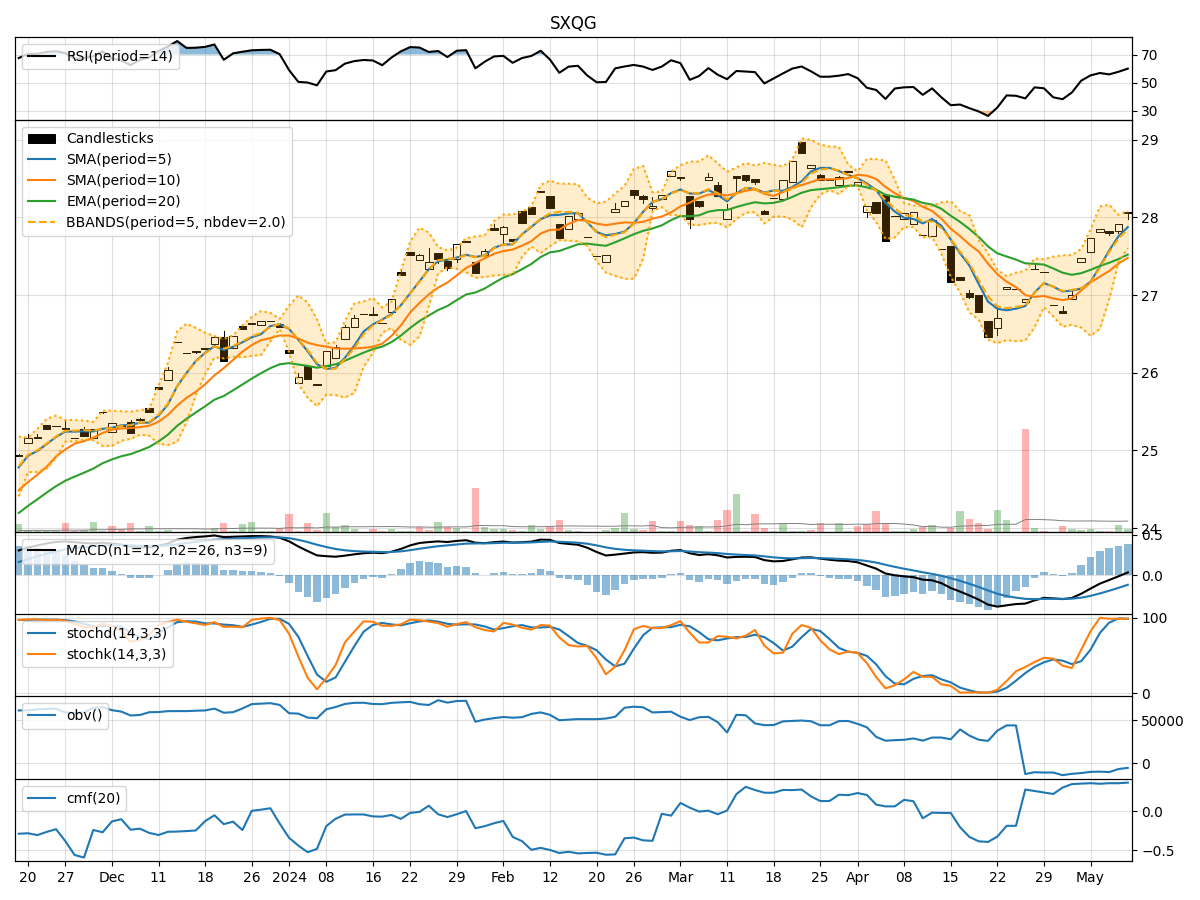
In analyzing the technical indicators for the stock SXQG over the last 5 days, we will delve into the trends, momentum, volatility, and volume aspects to provide a comprehensive outlook on the possible future stock price movement. By examining key indicators such as moving averages, MACD, RSI, Stochastic Oscillator, Bollinger Bands, and On-Balance Volume, we aim to offer valuable insights and predictions for the upcoming trading days.
Trend Analysis:
- Moving Averages (MA): The 5-day moving average has been consistently above the 10-day simple moving average, indicating a short-term bullish trend.
- MACD: The MACD line has been trending upwards, with the MACD histogram showing positive values, suggesting bullish momentum.
- EMA: The exponential moving average has been rising steadily, supporting the bullish trend.
Momentum Analysis:
- RSI: The Relative Strength Index has been increasing, reaching the overbought territory, indicating strong buying momentum.
- Stochastic Oscillator: Both %K and %D lines have been high, suggesting that the stock is in overbought conditions.
- Williams %R: The Williams %R is at 0, indicating that the stock is oversold.
Volatility Analysis:
- Bollinger Bands: The stock price has been trading close to the upper Bollinger Band, indicating high volatility and potential overbought conditions.
- Bollinger Band Width: The Band Width has been narrowing, suggesting a potential decrease in volatility.
Volume Analysis:
- On-Balance Volume (OBV): The OBV has been fluctuating but overall showing a slight decrease, indicating some distribution happening in the stock.
- Chaikin Money Flow (CMF): The CMF has been positive, indicating buying pressure in the stock.
Conclusion:
Based on the analysis of the technical indicators, the stock SXQG is currently exhibiting strong bullish momentum with overbought conditions. The trend is upward, supported by moving averages and MACD. However, the stock is trading near the upper Bollinger Band, suggesting potential overbought conditions and high volatility. The volume indicators show mixed signals with slight distribution seen in OBV.
Forecast:
Given the current technical setup, the stock price of SXQG is likely to experience a short-term pullback or consolidation in the upcoming trading days. Traders should exercise caution as the stock is in overbought territory, and a correction may be imminent. Long-term investors may consider waiting for a better entry point or booking partial profits.