Technical Analysis of SXUS 2024-05-10
Overview:
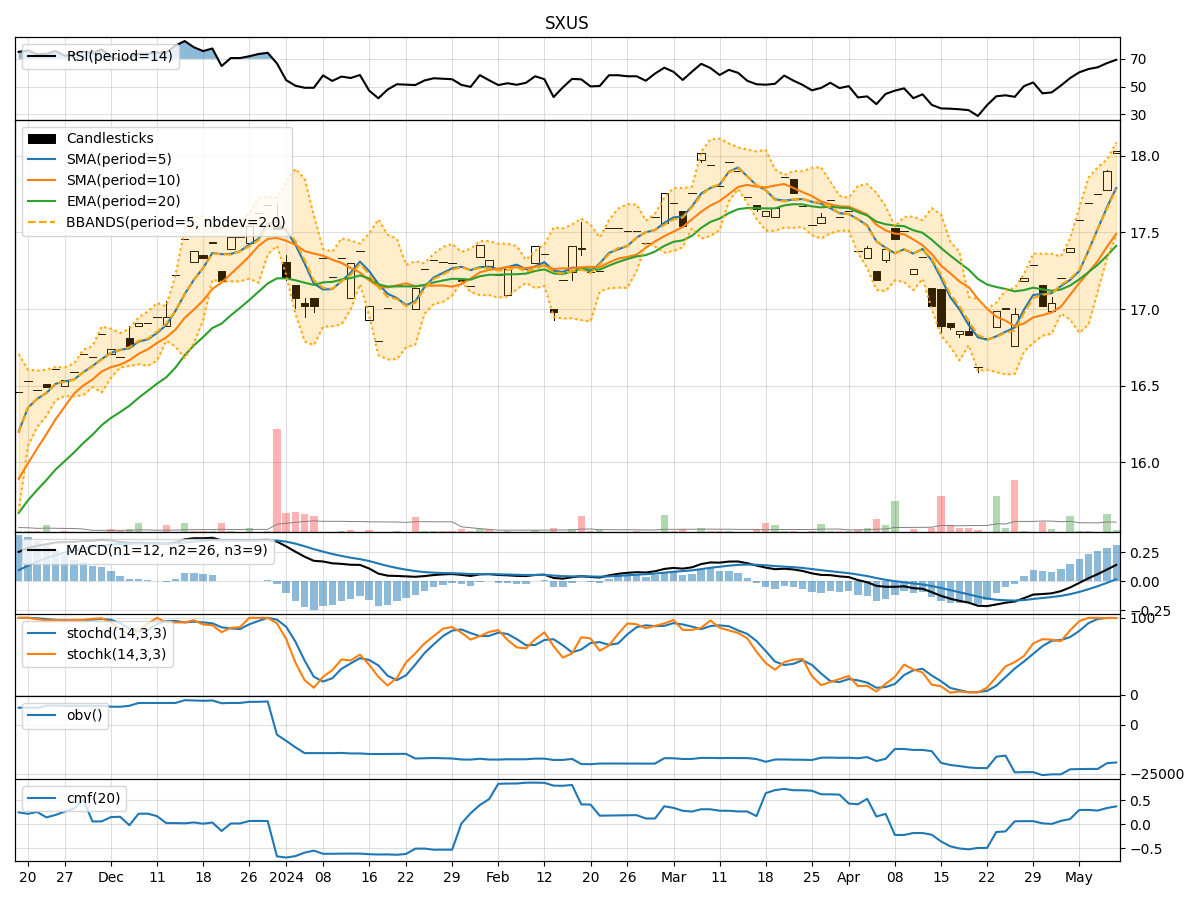
In the last 5 trading days, the stock price of SXUS has shown a consistent upward trend, supported by positive momentum and volatility indicators. The volume has also been relatively stable. The Moving Average Convergence Divergence (MACD) and Relative Strength Index (RSI) have been indicating bullish momentum. The Bollinger Bands (BB) have been expanding, suggesting increased volatility. On-balance volume (OBV) has been fluctuating but overall showing a positive trend.
Trend Indicators Analysis:
- Moving Averages (MA): The 5-day MA has been consistently above the 10-day Simple Moving Average (SMA), indicating a short-term bullish trend. The Exponential Moving Average (EMA) has been trending upwards, supporting the bullish sentiment.
- MACD: The MACD line has been consistently above the signal line, with both lines trending upwards. The MACD Histogram has been increasing, indicating strengthening bullish momentum.
Momentum Indicators Analysis:
- RSI: The RSI has been in the overbought territory but has room for further upside, suggesting continued bullish momentum.
- Stochastic Oscillator: Both %K and %D have been in the overbought zone, indicating a strong bullish momentum.
- Williams %R: The Williams %R has been fluctuating around the oversold level, suggesting potential for a reversal to the upside.
Volatility Indicators Analysis:
- Bollinger Bands: The widening of the Bollinger Bands indicates increasing volatility. The price has been consistently trading near the upper band, suggesting a strong uptrend.
- Bollinger %B: The %B indicator has been above 0.8, indicating an overbought condition but also a strong bullish trend.
Volume Indicators Analysis:
- On-Balance Volume (OBV): The OBV has shown some fluctuations but has been overall trending upwards, indicating accumulation by investors.
- Chaikin Money Flow (CMF): The CMF has been positive, suggesting that money is flowing into the stock.
Conclusion:
Based on the analysis of the technical indicators, the next few days for SXUS stock price are likely to see continued upward movement. The trend indicators, momentum indicators, and volatility indicators all point towards a bullish outlook. The stock is in a strong uptrend, supported by increasing buying pressure and positive investor sentiment. Traders and investors may consider buying opportunities on pullbacks to capitalize on the ongoing bullish momentum. It is important to monitor the indicators for any signs of potential reversal or consolidation in the future.