Technical Analysis of SYII 2024-05-10
Overview:
In analyzing the technical indicators for SYII over the last 5 days, we will delve into the trend, momentum, volatility, and volume indicators to provide a comprehensive outlook on the possible stock price movement in the coming days. By examining these key indicators, we aim to offer valuable insights and predictions for potential investors.
Trend Indicators:
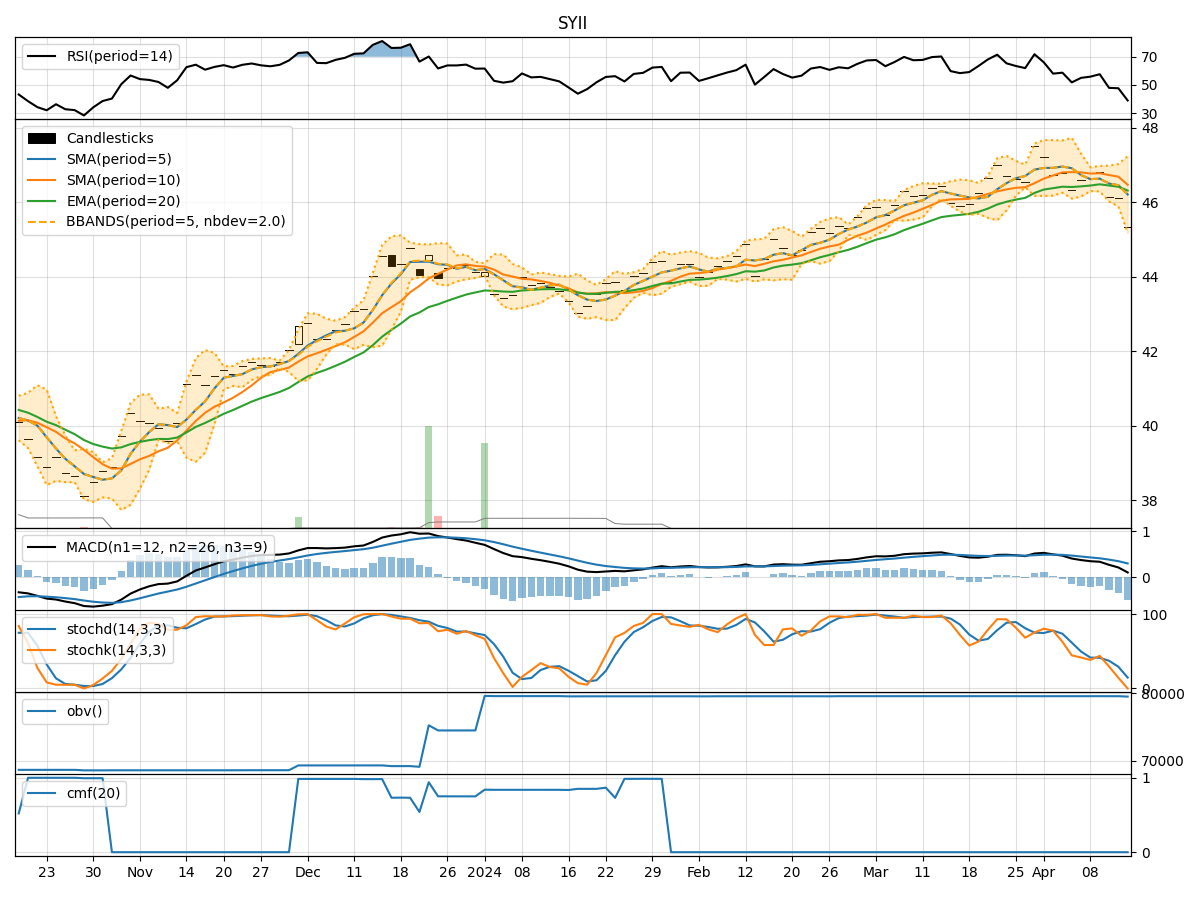
- Moving Averages (MA): The 5-day MA has been consistently above the closing prices, indicating a bullish trend.
- MACD: The MACD line has been positive and increasing, suggesting upward momentum.
- RSI: The RSI values have been in the overbought territory, indicating a strong bullish sentiment.
Key Observation: The trend indicators point towards a strong bullish trend in the stock price.
Momentum Indicators:
- Stochastic Oscillator: Both %K and %D values have been in the overbought region, signaling a potential reversal.
- Williams %R: The indicator has been consistently in the oversold region, suggesting a bearish sentiment.
Key Observation: Momentum indicators show conflicting signals with stochastic oscillator indicating a potential reversal while Williams %R signaling a bearish sentiment.
Volatility Indicators:
- Bollinger Bands (BB): The bands have been narrowing, indicating decreasing volatility.
- BB %B: The %B values have been fluctuating within a narrow range, suggesting stable price action.
Key Observation: Volatility indicators suggest low volatility and a period of consolidation in the stock price.
Volume Indicators:
- On-Balance Volume (OBV): The OBV has been relatively flat, indicating no significant divergence between volume and price movement.
- Chaikin Money Flow (CMF): The CMF has been negative, suggesting a bearish money flow.
Key Observation: Volume indicators reflect neutral volume and a bearish money flow sentiment.
Conclusion:
Based on the analysis of the technical indicators, the next few days' possible stock price movement for SYII is likely to experience a consolidation phase with low volatility. The conflicting signals from momentum indicators may lead to some short-term price fluctuations, but the overall trend remains bullish. Investors should exercise caution and consider potential reversals indicated by the stochastic oscillator. It is advisable to monitor the price action closely for any signs of a trend reversal.
In conclusion, the stock is expected to continue its upward trajectory in the medium to long term, but short-term fluctuations may occur. It is recommended to maintain a cautious bullish stance and consider potential entry points during price dips for long-term positions.