Technical Analysis of SYNB 2024-05-10
Overview:
In analyzing the technical indicators for SYNB over the last 5 days, we will delve into the trend, momentum, volatility, and volume indicators to provide a comprehensive outlook on the possible stock price movement. By examining these key aspects, we aim to offer valuable insights and predictions for the upcoming days.
Trend Indicators:
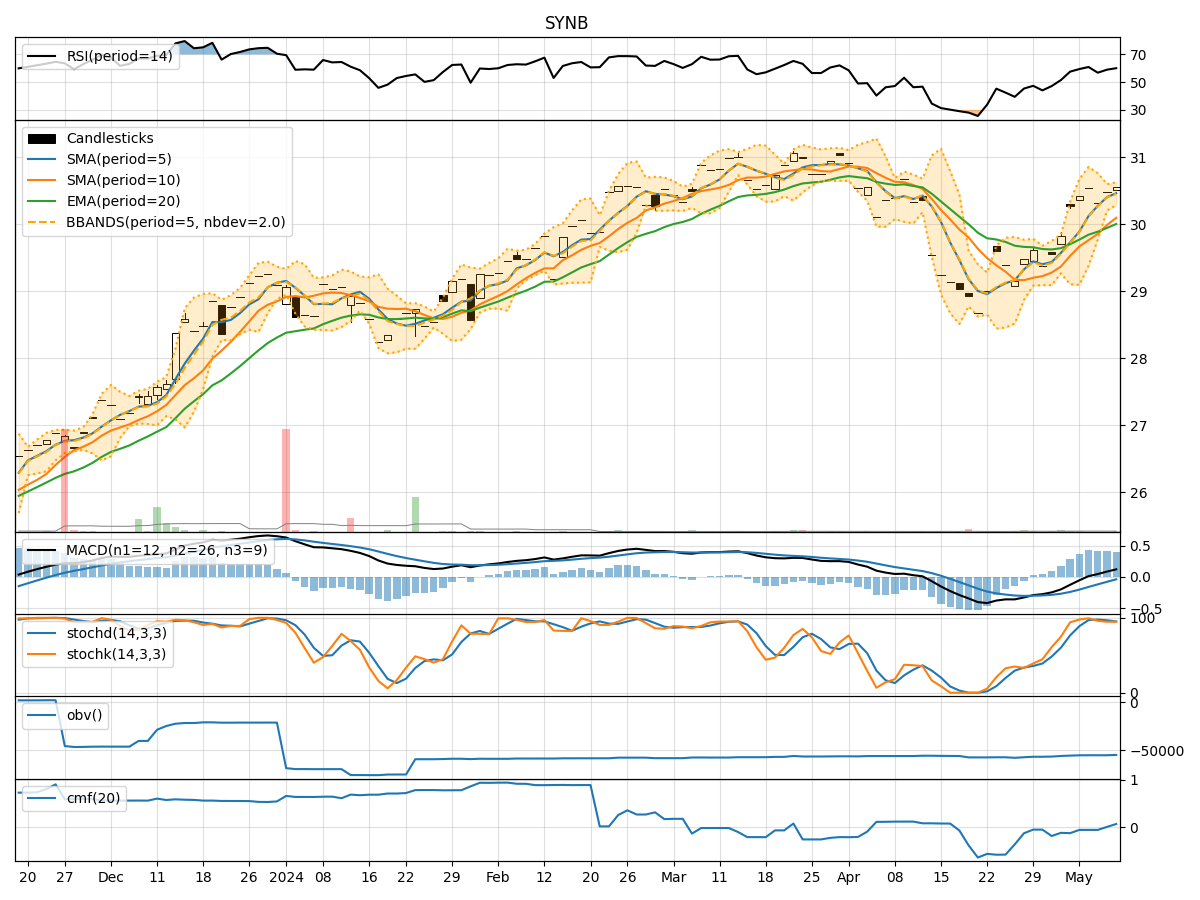
- Moving Averages (MA): The 5-day MA has been consistently above the 10-day SMA, indicating a short-term bullish trend.
- MACD: The MACD line has been above the signal line, suggesting a positive momentum in the stock price.
- RSI: The RSI has been fluctuating around the 60-70 range, indicating a neutral to slightly bullish sentiment.
Momentum Indicators:
- Stochastic Oscillator: The stochastic oscillator has been hovering in the overbought territory, suggesting a potential reversal or consolidation phase.
- Williams %R: The Williams %R has shown mixed signals, with some days indicating oversold conditions.
Volatility Indicators:
- Bollinger Bands: The stock price has mostly stayed within the Bollinger Bands, with occasional breaches indicating short-term volatility.
- BB% (Bollinger Band %B): The BB% has shown fluctuations but generally remains within the bands, indicating moderate volatility.
Volume Indicators:
- On-Balance Volume (OBV): The OBV has shown slight increases, suggesting some accumulation by investors.
- Chaikin Money Flow (CMF): The CMF has been negative, indicating some selling pressure in the stock.
Key Observations:
- The trend indicators suggest a short-term bullish bias in the stock price.
- Momentum indicators show signs of potential overbought conditions, hinting at a possible reversal or consolidation.
- Volatility indicators point towards moderate price fluctuations within the Bollinger Bands.
- Volume indicators indicate mixed signals with slight accumulation but negative CMF.
Conclusion:
Based on the analysis of the technical indicators, the next few days for SYNB could see some consolidation or a minor pullback as the stock may be approaching overbought levels. Investors should closely monitor the stochastic oscillator for potential reversal signals and keep an eye on the RSI for any shifts in momentum. Overall, the stock is likely to trade within a sideways range with a slightly bearish bias in the short term.