Technical Analysis of SYUS 2024-05-10
Overview:
In analyzing the technical indicators for SYUS over the last 5 days, we will delve into the trend, momentum, volatility, and volume indicators to provide a comprehensive outlook on the possible stock price movement in the coming days. By examining these key aspects, we aim to offer valuable insights and recommendations for potential investors.
Trend Indicators:
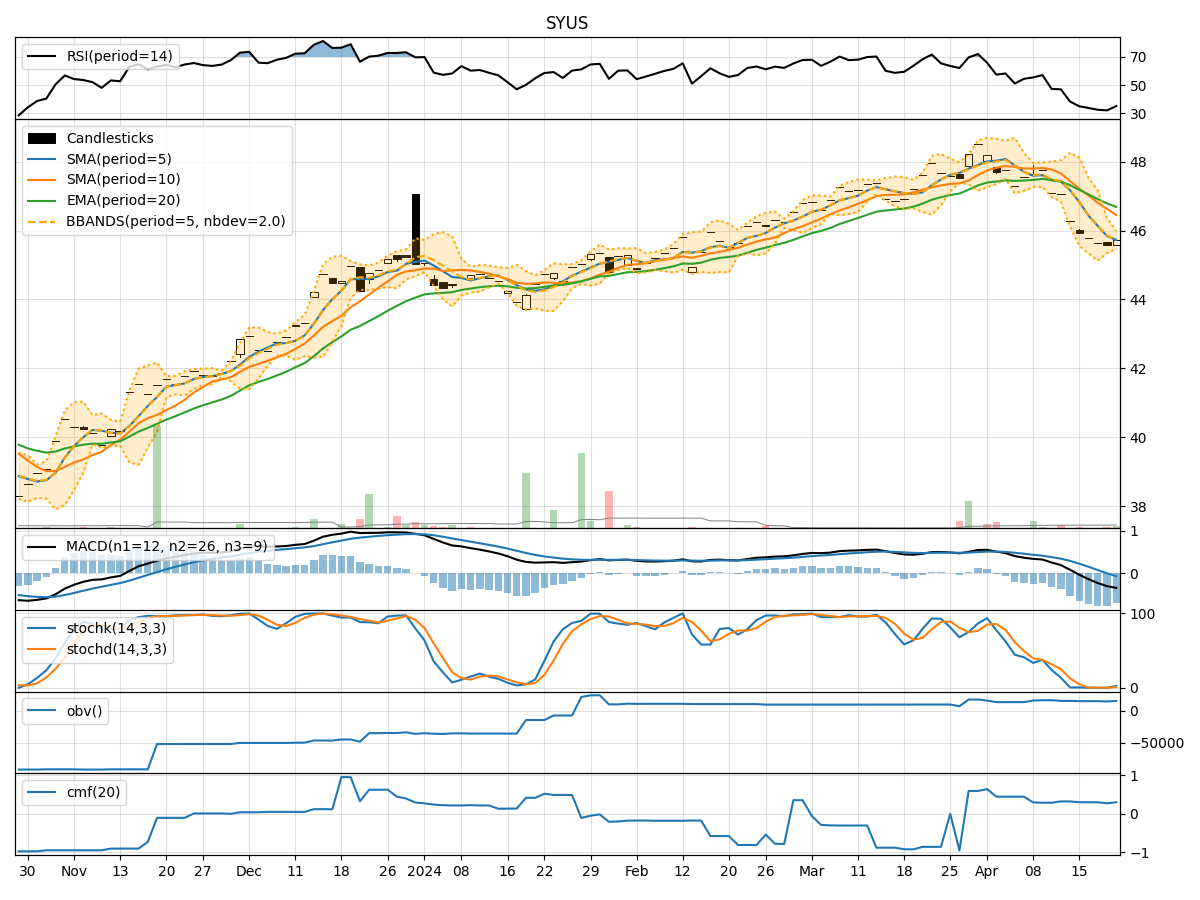
- Moving Averages (MA): The 5-day MA has been consistently above the closing prices, indicating a short-term uptrend.
- MACD: The MACD line has been trending upwards, crossing above the signal line, suggesting bullish momentum.
- EMA: The exponential moving average has been steadily increasing, supporting the bullish trend.
Momentum Indicators:
- RSI: The RSI has been in the overbought territory, indicating strong buying momentum.
- Stochastic Oscillator: Both %K and %D have been in the overbought zone, signaling a potential reversal.
- Williams %R: The indicator has been hovering around the oversold region, suggesting a possible reversal to the upside.
Volatility Indicators:
- Bollinger Bands: The stock price has been trading within the upper Bollinger Band, indicating an overbought condition.
- Bollinger Band Width: The band width has been narrowing, suggesting a potential decrease in volatility.
Volume Indicators:
- On-Balance Volume (OBV): The OBV has been relatively flat, indicating a lack of significant buying or selling pressure.
- Chaikin Money Flow (CMF): The CMF has been negative, reflecting a bearish money flow trend.
Key Observations and Opinions:
- Trend: The trend indicators suggest a bullish sentiment in the short term.
- Momentum: While momentum indicators show overbought conditions, the Williams %R indicates a potential reversal.
- Volatility: The narrowing Bollinger Band width suggests a possible decrease in volatility.
- Volume: The volume indicators do not show a clear trend, indicating a neutral stance.
Conclusion:
Based on the analysis of the technical indicators, the next few days' possible stock price movement for SYUS is likely to experience a short-term pullback or consolidation. The overbought conditions in the momentum indicators and the narrowing Bollinger Band width suggest a potential pause in the current uptrend. Investors should monitor the price action closely for signs of a reversal or continuation of the bullish trend.