Technical Analysis of TAFI 2024-05-10
Overview:
In analyzing the technical indicators for TAFI stock over the last 5 days, we will delve into the trend, momentum, volatility, and volume indicators to provide a comprehensive outlook on the possible stock price movement in the coming days. By examining these key indicators, we aim to offer valuable insights and predictions for potential investors.
Trend Analysis:
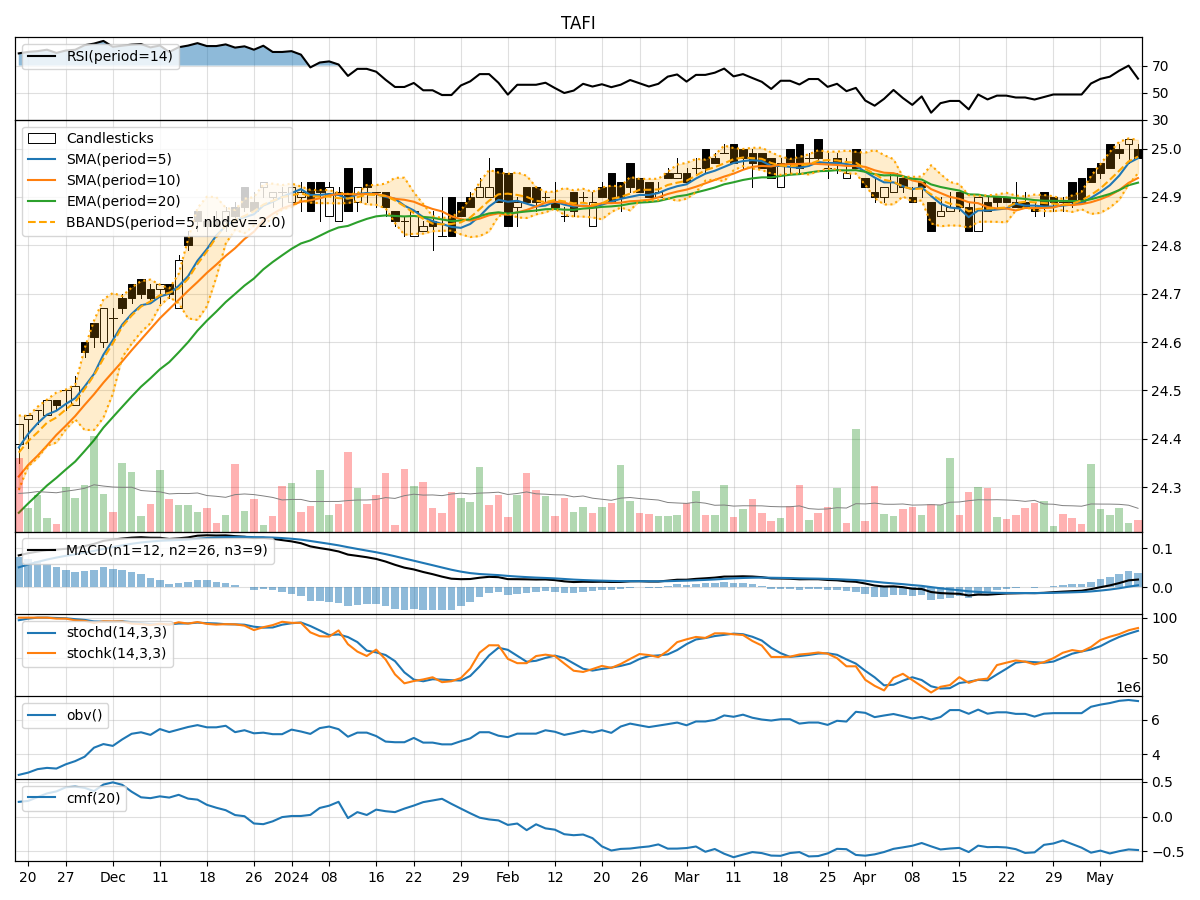
- Moving Averages (MA): The 5-day Moving Average (MA) has been consistently above the Simple Moving Average (SMA) and Exponential Moving Average (EMA), indicating a bullish trend.
- MACD: The MACD line has been above the signal line, with both lines showing an upward trend, suggesting bullish momentum in the stock price.
Momentum Analysis:
- RSI: The Relative Strength Index (RSI) has been fluctuating around the overbought territory, indicating strong buying momentum in the stock.
- Stochastic Oscillator: Both %K and %D lines of the Stochastic Oscillator are in the overbought zone, suggesting a strong bullish momentum.
Volatility Analysis:
- Bollinger Bands (BB): The stock price has been trading within the upper Bollinger Band, indicating high volatility in the short term.
Volume Analysis:
- On-Balance Volume (OBV): The OBV indicator has been showing a slight increase, suggesting accumulation by investors.
- Chaikin Money Flow (CMF): The CMF has been negative, indicating selling pressure in the stock.
Key Observations:
- The trend indicators suggest a bullish outlook with moving averages and MACD signaling upward momentum.
- Momentum indicators like RSI and Stochastic Oscillator indicate strong buying momentum in the stock.
- Volatility remains high, as seen from the Bollinger Bands, indicating potential price swings.
- Volume indicators show a mixed picture with OBV slightly increasing but CMF indicating selling pressure.
Conclusion:
Based on the analysis of the technical indicators, the next few days' possible stock price movement for TAFI stock is likely to be upward. The bullish trend, strong momentum, and high volatility suggest that the stock may experience further price appreciation. Investors could consider buying or holding positions in TAFI stock for potential gains in the near term.