Technical Analysis of TAFL 2024-05-10
Overview:
In analyzing the technical indicators for TAFL over the last 5 days, we will delve into the trend, momentum, volatility, and volume indicators to provide a comprehensive outlook on the possible stock price movement. By examining these key aspects, we aim to offer valuable insights and predictions for the upcoming days.
Trend Indicators:
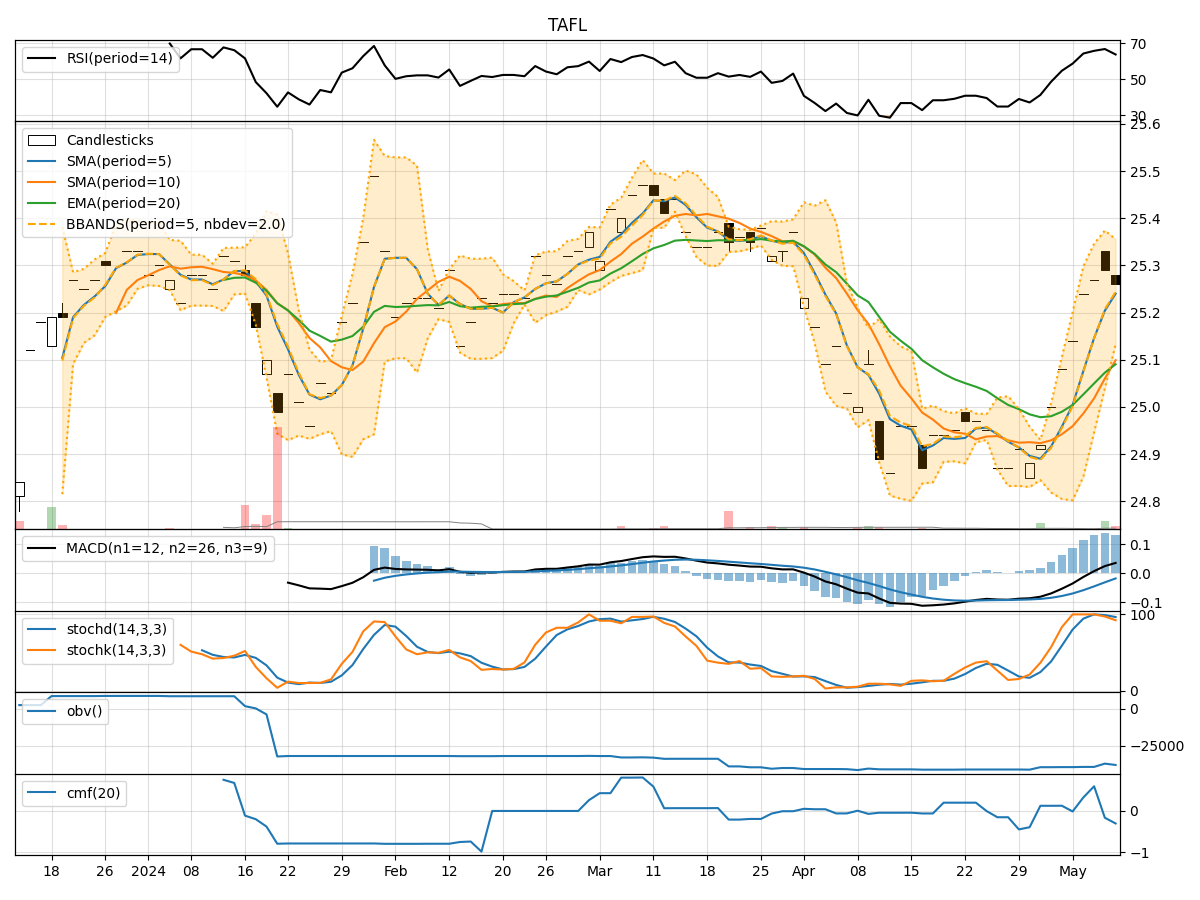
- Moving Averages (MA): The 5-day MA has been consistently above the closing price, indicating a short-term uptrend.
- MACD: The MACD line has been above the signal line, suggesting bullish momentum.
- RSI: The RSI has been in the overbought territory, reflecting strong buying pressure.
Key Observation: The trend indicators point towards a bullish sentiment in the short term.
Momentum Indicators:
- Stochastic Oscillator: Both %K and %D have been in the overbought region, signaling potential overvaluation.
- Williams %R: The indicator has been in the oversold territory, indicating a possible reversal.
Key Observation: Momentum indicators suggest a mixed outlook with signs of potential overbought conditions.
Volatility Indicators:
- Bollinger Bands: The price has mostly stayed within the bands, indicating stability.
- Volatility: The bands have narrowed, suggesting decreased price fluctuations.
Key Observation: Volatility indicators imply a sideways movement with reduced price swings.
Volume Indicators:
- On-Balance Volume (OBV): The OBV has shown mixed signals with fluctuations in volume.
- Chaikin Money Flow (CMF): The CMF has been negative, indicating selling pressure.
Key Observation: Volume indicators reflect a neutral to bearish sentiment with varying volume patterns.
Conclusion:
Based on the analysis of trend, momentum, volatility, and volume indicators, the overall outlook for TAFL in the next few days appears to be mixed with a slight bullish bias in the short term. While trend indicators suggest a bullish sentiment, momentum indicators indicate potential overbought conditions. Volatility indicators point towards a sideways movement, and volume indicators reflect a neutral to bearish stance.
Therefore, the next few days may see a continuation of the current uptrend with possible consolidation or a minor pullback due to overbought conditions. Traders should closely monitor key levels and consider taking profits or implementing risk management strategies.