Technical Analysis of TAFM 2024-05-10
Overview:
In analyzing the technical indicators for TAFM over the last 5 days, we will delve into the trends, momentum, volatility, and volume aspects to provide a comprehensive outlook on the possible stock price movement in the coming days. By examining key indicators such as moving averages, MACD, RSI, Bollinger Bands, and OBV, we aim to offer valuable insights and predictions for informed decision-making.
Trend Analysis:
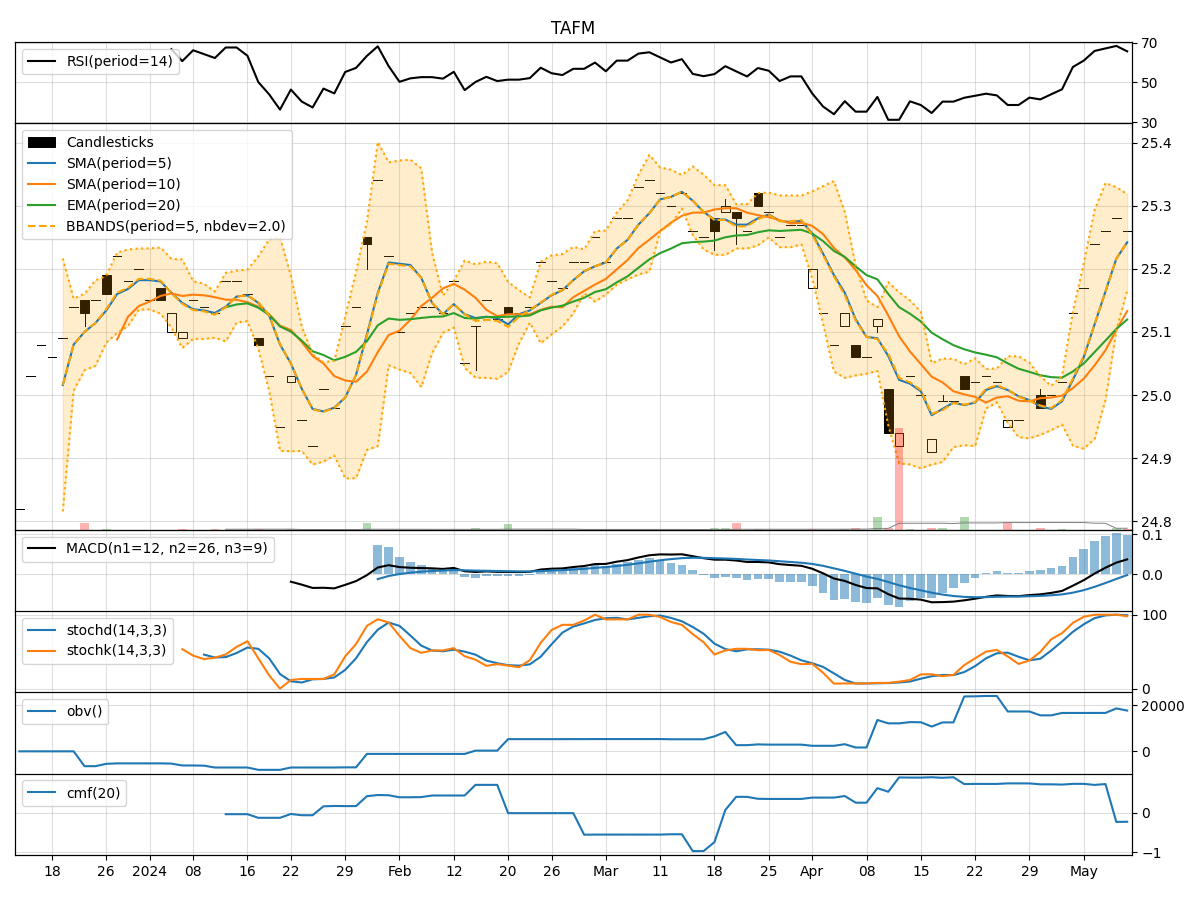
- Moving Averages (MA): The 5-day moving average has been consistently above the closing prices, indicating an upward trend in the short term.
- MACD: The MACD line has been above the signal line for the past few days, suggesting bullish momentum in the stock.
Momentum Analysis:
- RSI: The RSI has been hovering around 65-70, indicating neutral to slightly bullish momentum in the stock.
- Stochastic Oscillator: Both %K and %D have been relatively high, suggesting the stock is overbought in the short term.
Volatility Analysis:
- Bollinger Bands: The stock price has been trading within the Bollinger Bands, with the bands narrowing, indicating lower volatility and a possible consolidation phase.
Volume Analysis:
- On-Balance Volume (OBV): The OBV has shown mixed signals, with a slight decrease in volume on the last trading day, indicating some selling pressure.
Key Observations and Opinions:
- The stock is currently in an upward trend based on moving averages and MACD.
- Momentum indicators suggest neutral to slightly bullish sentiment.
- Volatility is decreasing, indicating a potential consolidation phase.
- Volume has shown some signs of selling pressure but remains relatively stable.
Conclusion:
Based on the analysis of technical indicators, the next few days' possible stock price movement for TAFM is likely to experience sideways consolidation with a slight bullish bias. Traders may expect the stock to trade within a narrow range as volatility decreases, while momentum remains relatively positive. It is advisable to closely monitor key support and resistance levels for potential breakout opportunities.