Technical Analysis of TAGS 2024-05-10
Overview:
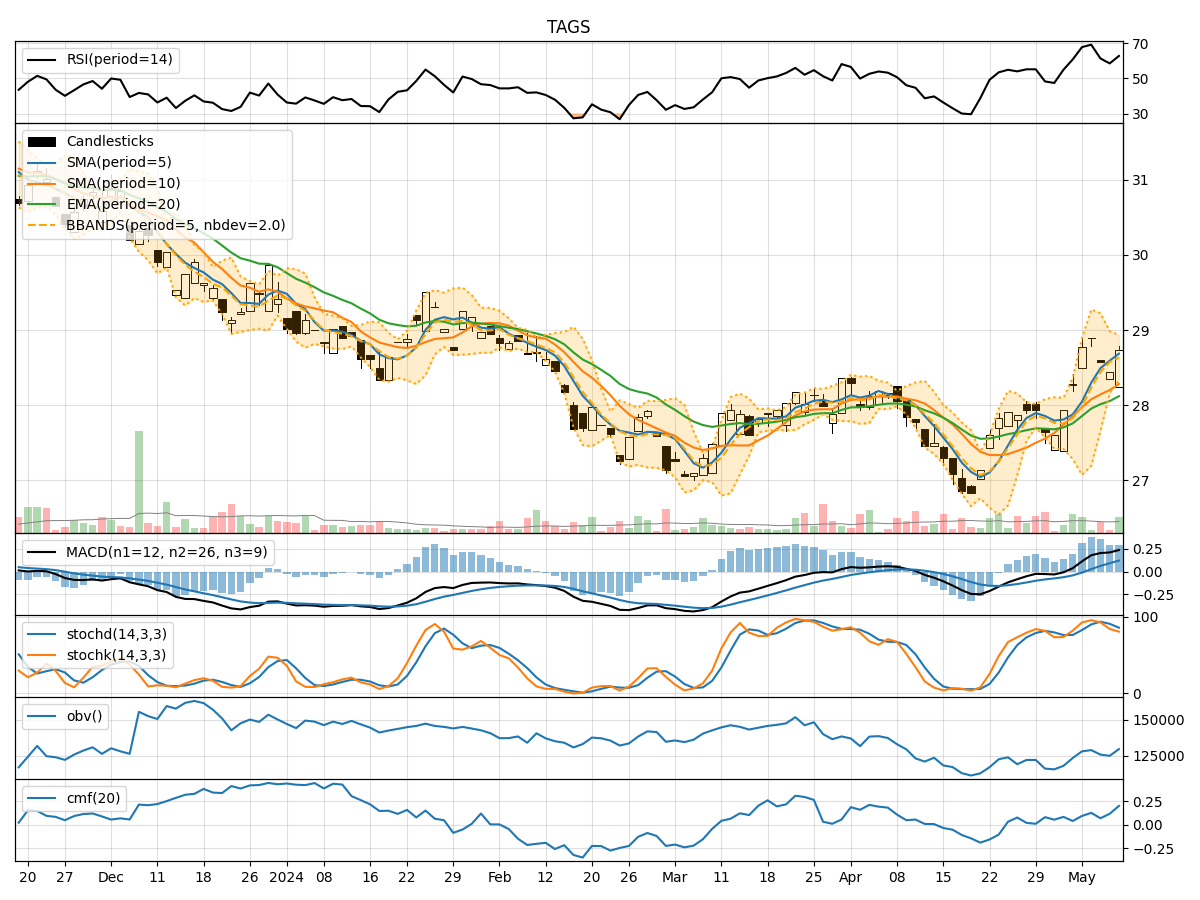
In analyzing the provided technical indicators for the last 5 days, we will delve into the trend, momentum, volatility, and volume indicators to gain a comprehensive understanding of the stock's potential price movement. By examining these key aspects, we aim to provide valuable insights and predictions for the next few days.
Trend Indicators:
- Moving Averages (MA): The 5-day Moving Average (MA) has been consistently above the Simple Moving Average (SMA) and Exponential Moving Average (EMA), indicating a bullish trend.
- MACD: The Moving Average Convergence Divergence (MACD) has shown positive values, with the MACD line consistently above the Signal line, suggesting bullish momentum.
Momentum Indicators:
- RSI: The Relative Strength Index (RSI) has been fluctuating around the 60-70 range, indicating a neutral momentum.
- Stochastic Oscillator: The Stochastic Oscillator has been gradually decreasing but remains above the oversold threshold, suggesting a potential reversal.
Volatility Indicators:
- Bollinger Bands (BB): The Bollinger Bands have been narrowing, indicating decreasing volatility and a potential price breakout.
Volume Indicators:
- On-Balance Volume (OBV): The OBV has shown mixed signals, with some days experiencing negative volume divergence.
- Chaikin Money Flow (CMF): The CMF has been positive, indicating buying pressure in the market.
Key Observations:
- The trend indicators suggest a bullish sentiment, supported by the positive MACD values and the MA being above the SMA and EMA.
- Momentum indicators show a neutral stance, with RSI hovering in the middle range and Stochastic Oscillator indicating a potential reversal.
- Volatility indicators point towards decreasing volatility, potentially leading to a breakout in price movement.
- Volume indicators exhibit mixed signals, with OBV showing some negative divergence but CMF indicating buying pressure.
Conclusion:
Based on the analysis of the technical indicators, the stock is likely to experience upward movement in the next few days. The bullish trend supported by the positive MACD values and moving averages, coupled with decreasing volatility and potential buying pressure indicated by the CMF, suggests a favorable outlook for the stock price. Traders and investors may consider buying opportunities in anticipation of a price increase.