Technical Analysis of TARK 2024-05-10
Overview:
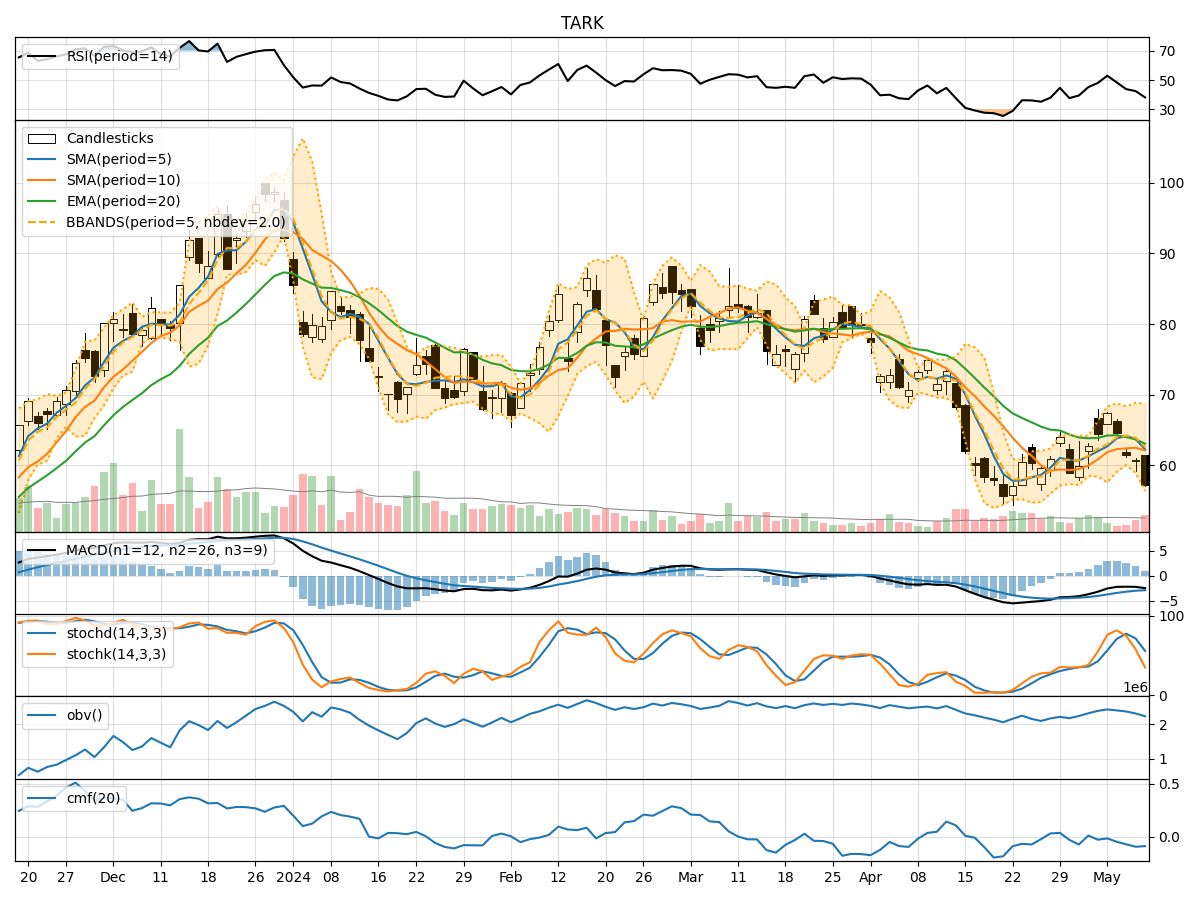
In analyzing the technical indicators for TARK stock over the last 5 days, we will delve into the trend, momentum, volatility, and volume indicators to provide a comprehensive outlook on the possible stock price movement in the coming days. By examining these key indicators, we aim to offer valuable insights and predictions for potential investors.
Trend Analysis:
- Moving Averages (MA): The 5-day Moving Average (MA) has been declining steadily, indicating a bearish trend in the short term.
- MACD: The Moving Average Convergence Divergence (MACD) has been consistently negative, suggesting a bearish momentum in the stock.
- EMA: The Exponential Moving Average (EMA) has also been trending downwards, reinforcing the bearish sentiment in the stock.
Momentum Analysis:
- RSI: The Relative Strength Index (RSI) has been decreasing, indicating a weakening momentum in the stock.
- Stochastic Oscillator: Both %K and %D of the Stochastic Oscillator have been declining, signaling a bearish momentum.
- Williams %R: The Williams %R is in oversold territory, suggesting a potential reversal or bounce in the stock price.
Volatility Analysis:
- Bollinger Bands: The Bollinger Bands width has been narrowing, indicating decreasing volatility in the stock.
- Bollinger %B: The %B indicator is approaching the lower band, suggesting a possible oversold condition in the stock.
Volume Analysis:
- On-Balance Volume (OBV): The OBV has been fluctuating, indicating indecision among investors regarding the stock.
- Chaikin Money Flow (CMF): The CMF has been negative, reflecting selling pressure in the stock.
Conclusion:
Based on the analysis of the technical indicators, the stock of TARK is currently in a bearish phase. The trend indicators, momentum oscillators, and volume indicators all point towards a downward movement in the stock price in the coming days. The narrowing Bollinger Bands and oversold Williams %R suggest a possible short-term bounce or consolidation, but the overall outlook remains bearish.
Investors should exercise caution and consider waiting for a more definitive signal or confirmation of a trend reversal before considering any long positions. Short-term traders may find opportunities to capitalize on potential oversold bounces, but the overall trend suggests a downward bias in the near future.