Technical Analysis of TAXX 2024-05-10
Overview:
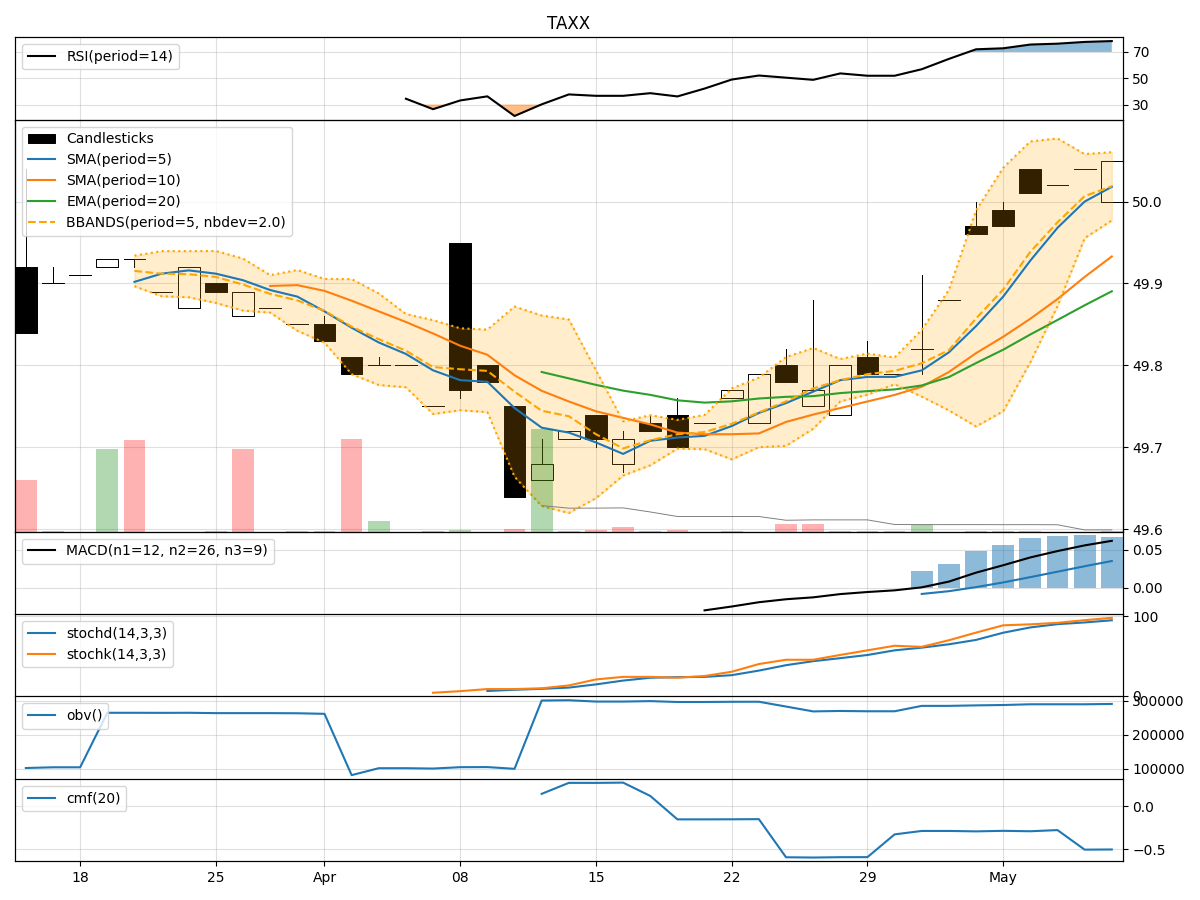
In the last 5 trading days, TAXX stock has shown a consistent uptrend in price, supported by increasing volume. The moving averages have been trending upwards, indicating a positive momentum. Additionally, momentum indicators like RSI and Stochastic oscillators suggest that the stock is in overbought territory. Volatility indicators show a narrowing of the Bollinger Bands, indicating potential price consolidation. However, the Chaikin Money Flow remains negative, suggesting selling pressure.
Trend Analysis:
- Moving Averages (MA): The 5-day MA has been consistently above the 10-day SMA, indicating a short-term bullish trend. The EMA(20) is also trending upwards, supporting the bullish sentiment.
- MACD: The MACD line has been above the signal line for the past 5 days, indicating a bullish trend. The MACD histogram has been increasing, showing strengthening bullish momentum.
Momentum Analysis:
- RSI: The RSI has been consistently above 70, indicating overbought conditions. This suggests that the stock may be due for a pullback or consolidation.
- Stochastic Oscillators: Both %K and %D lines are in the overbought zone, signaling a potential reversal or consolidation in the near future.
Volatility Analysis:
- Bollinger Bands (BB): The Bollinger Bands have been narrowing, indicating decreasing volatility and a potential period of consolidation. The %B indicator is hovering around 0.8, suggesting the stock is trading near the upper band.
- Average True Range (ATR): ATR has been decreasing, further confirming the decrease in volatility.
Volume Analysis:
- On-Balance Volume (OBV): The OBV has been relatively flat, indicating a balance between buying and selling pressure. This suggests that the recent price increase may not be fully supported by volume.
- Chaikin Money Flow (CMF): The CMF remains negative, indicating distribution and potential selling pressure in the stock.
Conclusion:
Based on the technical indicators and analysis: - Trend: The stock is in a strong upward trend. - Momentum: The stock is overbought and may experience a pullback or consolidation. - Volatility: Volatility is decreasing, suggesting a potential period of consolidation. - Volume: The volume does not fully support the recent price increase.
Overall Opinion:
Given the overbought conditions, potential consolidation indicated by narrowing Bollinger Bands, and negative Chaikin Money Flow, the next few days for TAXX stock are likely to see a sideways movement or a slight pullback. Traders should exercise caution and consider taking profits or waiting for a better entry point before considering new positions.