Technical Analysis of TBFC 2024-05-10
Overview:
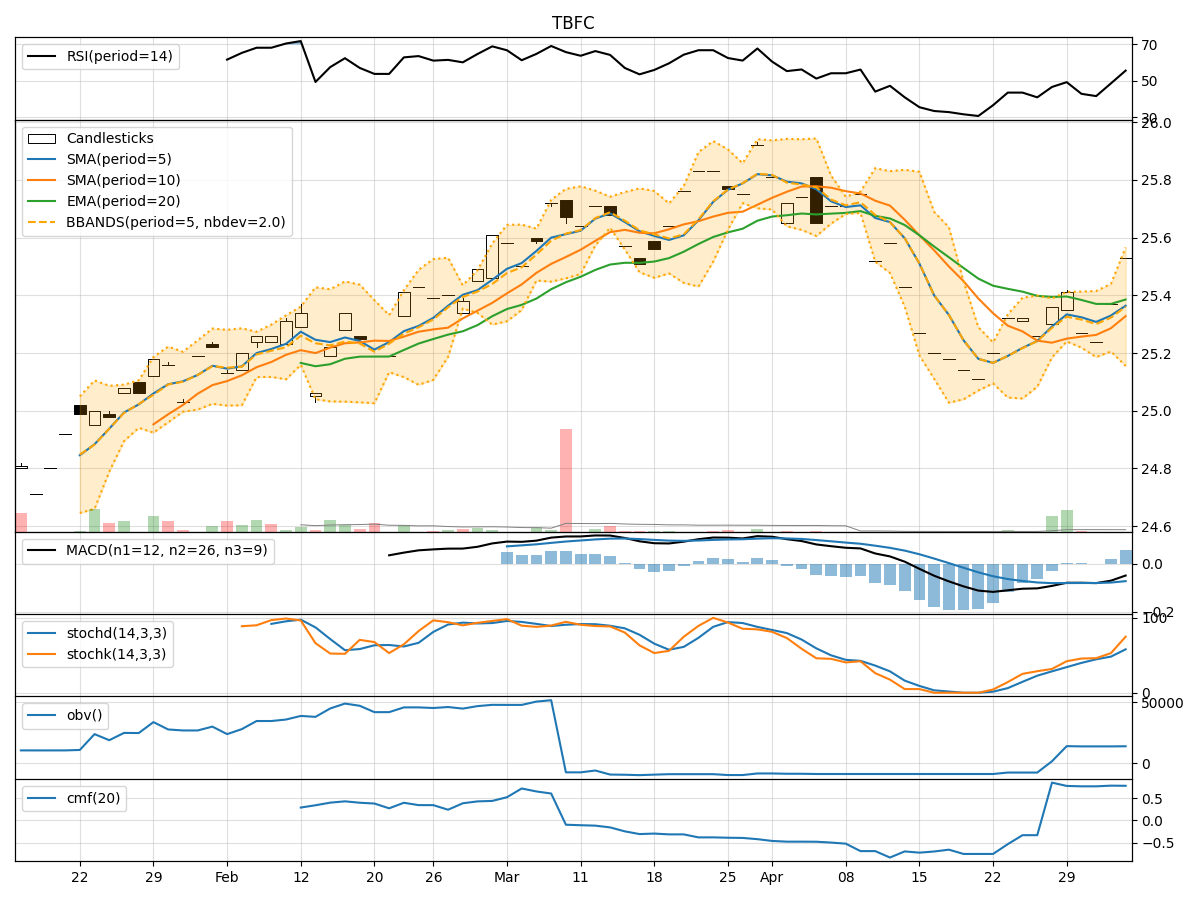
In analyzing the technical indicators for TBFC over the last 5 days, we will delve into the trend, momentum, volatility, and volume indicators to provide a comprehensive outlook on the possible stock price movement in the coming days. By examining these key aspects, we aim to offer valuable insights and predictions for informed decision-making.
Trend Analysis:
- Moving Averages (MA): The 5-day Moving Average (MA) has been consistently above the Simple Moving Average (SMA) and Exponential Moving Average (EMA), indicating a bullish trend.
- MACD: The MACD line has been consistently above the signal line, with both lines showing an upward trend, suggesting bullish momentum.
Key Observation: The trend indicators suggest a strong bullish sentiment in the stock price movement.
Momentum Analysis:
- RSI: The Relative Strength Index (RSI) has been hovering around 60-62, indicating a neutral to slightly bullish momentum.
- Stochastic Oscillator: Both %K and %D have been fluctuating in the overbought territory, suggesting a potential reversal or consolidation.
Key Observation: Momentum indicators show a mixed signal with a slight bullish bias.
Volatility Analysis:
- Bollinger Bands (BB): The stock price has been trading within the Bollinger Bands, with the bands narrowing, indicating decreasing volatility.
Key Observation: Volatility has been decreasing, potentially leading to a period of consolidation or a breakout.
Volume Analysis:
- On-Balance Volume (OBV): The OBV has been negative, indicating selling pressure in the stock.
- Chaikin Money Flow (CMF): The CMF has been relatively stable around 0.60, suggesting a neutral money flow trend.
Key Observation: Volume indicators reflect a lack of strong buying interest, potentially limiting upward momentum.
Conclusion:
Based on the analysis of the technical indicators, the stock of TBFC is currently exhibiting a bullish trend with mixed momentum signals. The decreasing volatility suggests a possible period of consolidation or a breakout in the near future. However, the lack of strong buying volume raises concerns about the sustainability of the bullish trend.
Recommendation:
Considering the overall analysis, it is advisable to exercise caution in trading TBFC in the next few days. Traders should closely monitor key levels such as support and resistance to gauge the stock's price movement. A wait-and-see approach might be prudent until a clearer trend emerges. It is essential to consider both technical indicators and market dynamics before making any trading decisions.