Technical Analysis of TBFG 2024-05-10
Overview:
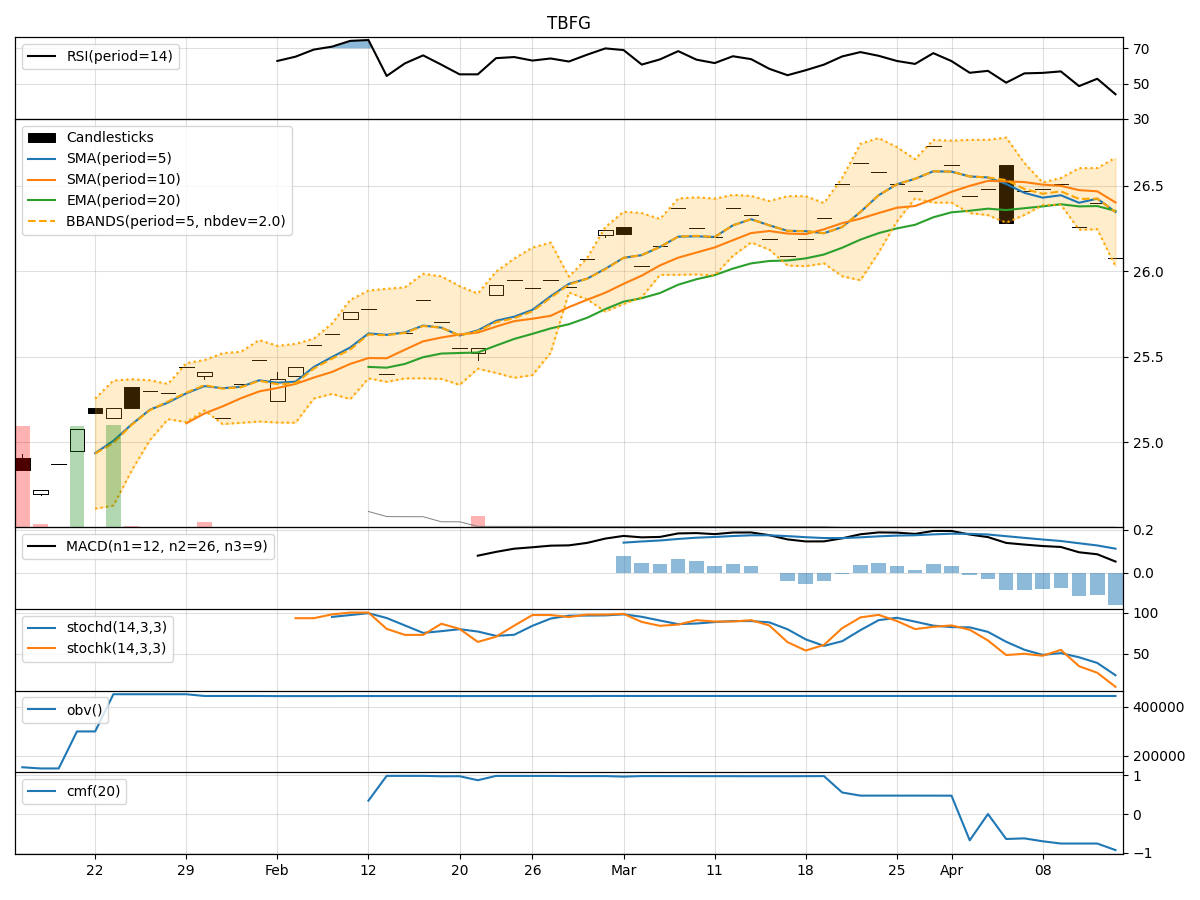
In analyzing the technical indicators for TBFG stock over the last 5 days, we will delve into the trends, momentum, volatility, and volume aspects to provide a comprehensive outlook on the possible stock price movement in the upcoming days.
Trend Analysis:
- Moving Averages (MA): The 5-day Moving Average (MA) has been consistently above the Simple Moving Average (SMA) and Exponential Moving Average (EMA), indicating a bullish trend.
- MACD: The MACD line has been consistently above the signal line, with the MACD Histogram showing an increasing positive value, further supporting the bullish trend.
Momentum Analysis:
- RSI: The Relative Strength Index (RSI) has been in the range of 50-70, indicating a moderate bullish momentum.
- Stochastic Oscillator: Both %K and %D have been consistently high, suggesting strong bullish momentum.
- Williams %R: The indicator has been hovering around 0, indicating a neutral momentum.
Volatility Analysis:
- Bollinger Bands (BB): The stock price has been trading within the Bollinger Bands, with the bands narrowing slightly, indicating decreasing volatility.
- Bollinger %B: The %B indicator has been fluctuating around 0.8, suggesting the stock is trading closer to the upper band.
Volume Analysis:
- On-Balance Volume (OBV): The OBV has been relatively stable, indicating consistent buying pressure.
- Chaikin Money Flow (CMF): The CMF has been at 0, suggesting a balance between buying and selling pressure.
Key Observations:
- The trend indicators suggest a strong bullish sentiment, supported by the moving averages and MACD.
- Momentum indicators indicate a moderate bullish momentum, with the RSI and Stochastic Oscillator showing strength.
- Volatility has been decreasing, as seen in the narrowing Bollinger Bands.
- Volume indicators show consistent buying pressure but with a balanced CMF.
Conclusion:
Based on the analysis of the technical indicators, the next few days for TBFG stock are likely to see continued upward movement. The bullish trend, supported by strong momentum and decreasing volatility, indicates a positive outlook for the stock price. Traders and investors may consider buying opportunities in the coming days, as the stock shows potential for further gains.