Technical Analysis of TBG 2024-05-10
Overview:
In analyzing the technical indicators for TBG stock over the last 5 days, we will delve into the trend, momentum, volatility, and volume indicators to provide a comprehensive outlook on the possible stock price movement in the coming days. By examining these key indicators, we aim to offer valuable insights and predictions for potential investors.
Trend Analysis:
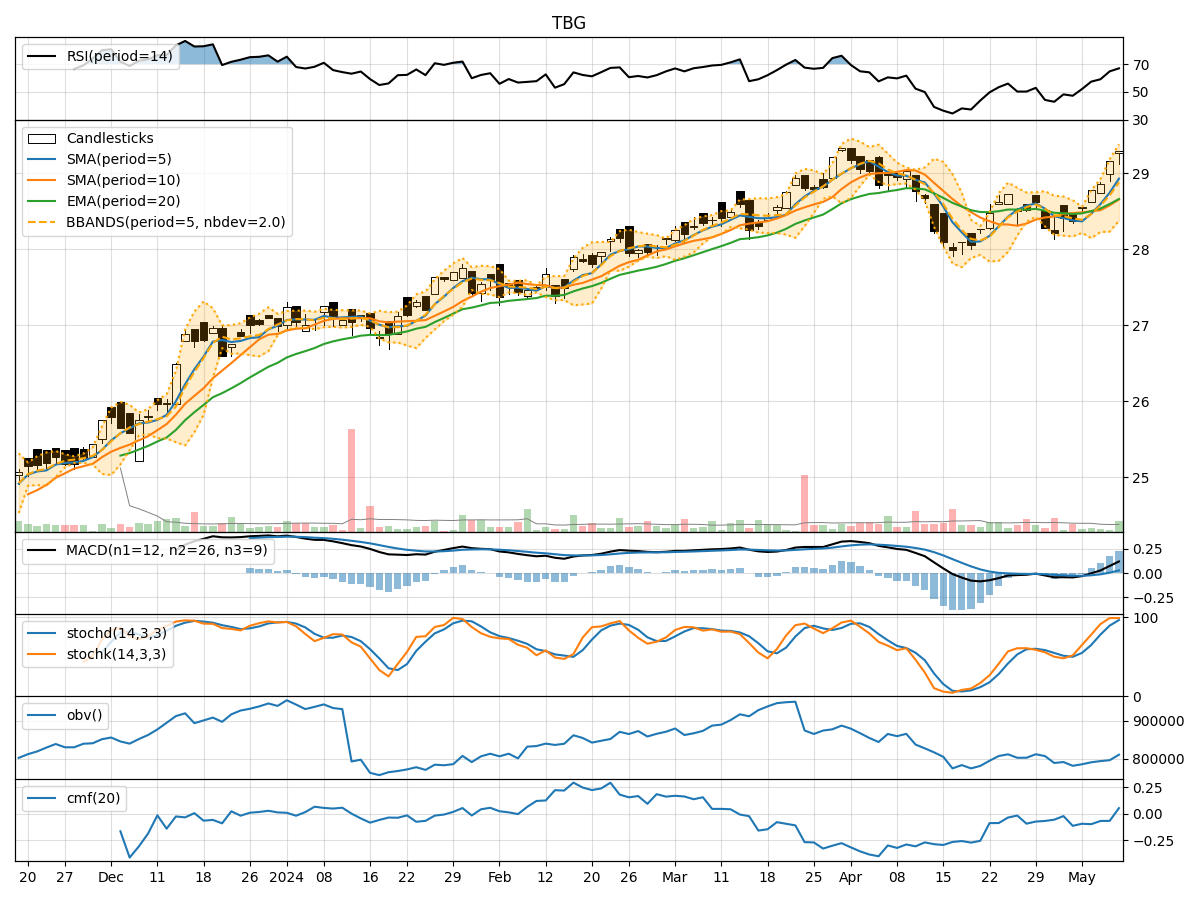
- Moving Averages (MA): The 5-day MA has been trending upwards, indicating a positive momentum in the stock price.
- MACD: The MACD line has been consistently above the signal line, suggesting a bullish trend.
- RSI: The RSI has been increasing, showing strengthening buying momentum.
Key Observation: The trend indicators point towards a bullish sentiment in the stock price movement.
Momentum Analysis:
- Stochastic Oscillator: Both %K and %D have been in the overbought zone, indicating a strong bullish momentum.
- Williams %R: The indicator has been consistently at or near the oversold level, signaling a potential reversal.
Key Observation: Momentum indicators suggest a strong bullish sentiment in the stock.
Volatility Analysis:
- Bollinger Bands (BB): The bands have been widening, indicating increased volatility in the stock price.
- Bollinger %B: The %B has been fluctuating within a range, suggesting potential price reversals.
Key Observation: Volatility indicators imply a mixed sentiment with potential price fluctuations.
Volume Analysis:
- On-Balance Volume (OBV): The OBV has shown mixed movements, indicating indecision among investors.
- Chaikin Money Flow (CMF): The CMF has been negative, suggesting outflow of money from the stock.
Key Observation: Volume indicators reflect uncertainty in the stock price movement.
Conclusion:
Based on the analysis of trend, momentum, volatility, and volume indicators, the overall outlook for TBG stock suggests a bullish sentiment in the short term. The trend indicators, supported by strong momentum signals, indicate a potential upward movement in the stock price. However, the volatility and volume indicators point towards some uncertainty and potential price fluctuations.
Recommendation:
Considering the bullish trend and momentum, investors may consider buying TBG stock for potential short-term gains. However, it is essential to monitor the volatility and volume indicators closely to manage risks effectively. Additionally, conducting further research and analysis on fundamental factors can provide a more holistic view before making investment decisions.