Technical Analysis of TBJL 2024-05-10
Overview:
In analyzing the technical indicators for TBJL stock over the last 5 days, we will delve into the trend, momentum, volatility, and volume indicators to provide a comprehensive outlook on the possible stock price movement in the coming days. By examining these key aspects, we aim to offer valuable insights and predictions to guide investment decisions.
Trend Analysis:
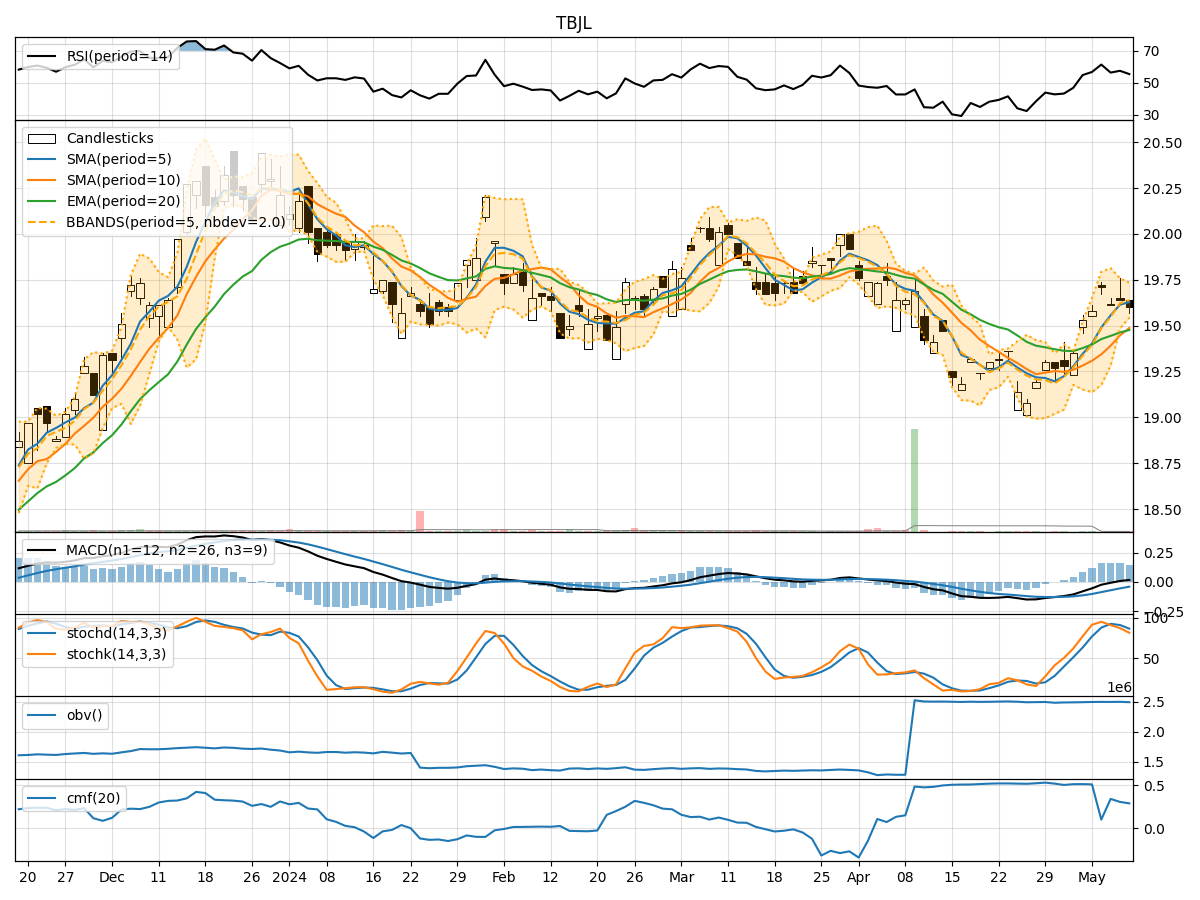
- Moving Averages (MA): The 5-day Moving Average (MA) has been consistently above the Simple Moving Average (SMA) and Exponential Moving Average (EMA), indicating a bullish trend.
- MACD: The Moving Average Convergence Divergence (MACD) has shown positive values, with the MACD line consistently above the Signal line, suggesting bullish momentum.
Momentum Analysis:
- RSI: The Relative Strength Index (RSI) has been fluctuating around the 50 level, indicating a neutral momentum.
- Stochastic Oscillator: Both %K and %D values have been decreasing, signaling a potential bearish momentum.
Volatility Analysis:
- Bollinger Bands (BB): The Bollinger Bands have been narrowing, indicating decreasing volatility in the stock price.
Volume Analysis:
- On-Balance Volume (OBV): The OBV has shown mixed movements, reflecting indecision among investors.
- Chaikin Money Flow (CMF): The CMF has been positive but fluctuating, suggesting some buying pressure.
Key Observations:
- The trend indicators suggest a bullish sentiment in the short term.
- Momentum indicators show a mixed picture with neutral to slightly bearish signals.
- Volatility has been decreasing, indicating potential consolidation.
- Volume indicators reflect indecision among market participants.
Conclusion:
Based on the analysis of the technical indicators, the stock price of TBJL is likely to experience a period of consolidation in the coming days. While the trend indicators point towards a bullish outlook, the mixed signals from momentum indicators and the decreasing volatility suggest a lack of strong directional bias. Investors should closely monitor key support and resistance levels for potential breakout or reversal signals. It is advisable to exercise caution and wait for clearer signals before making significant trading decisions.