Technical Analysis of TCHI 2024-05-10
Overview:
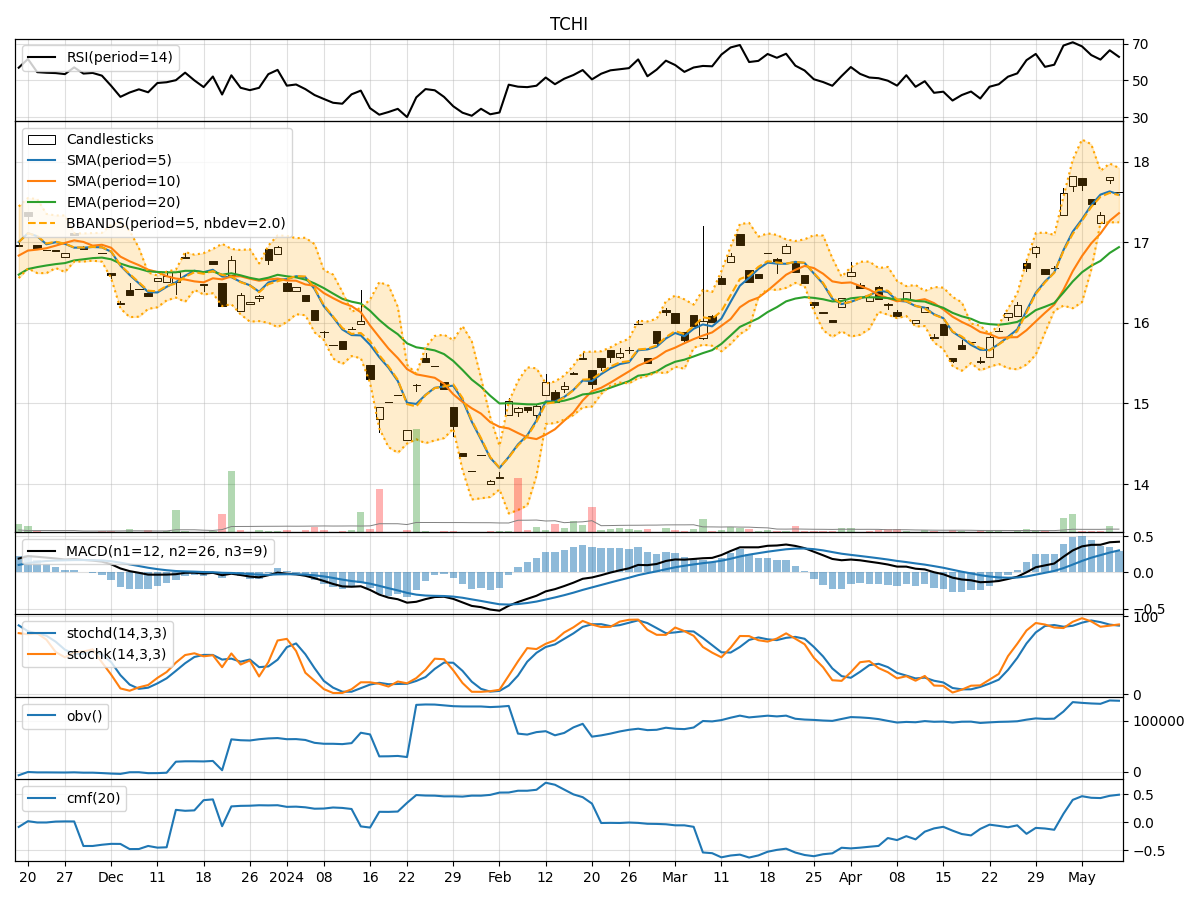
In analyzing the technical indicators for TCHI over the last 5 days, we will delve into the trend, momentum, volatility, and volume indicators to provide a comprehensive outlook on the possible stock price movement in the coming days.
Trend Analysis:
- Moving Averages (MA): The 5-day Moving Average (MA) has been consistently above the Simple Moving Average (SMA) and Exponential Moving Average (EMA), indicating a bullish trend.
- MACD: The MACD line has been consistently above the signal line, with both lines showing an upward trend, suggesting bullish momentum.
Momentum Analysis:
- RSI: The Relative Strength Index (RSI) has been fluctuating but generally staying within the neutral range, indicating a balanced momentum.
- Stochastic Oscillator: Both %K and %D have been fluctuating but staying above the oversold threshold, suggesting a potential continuation of the current trend.
Volatility Analysis:
- Bollinger Bands (BB): The stock price has been trading within the Bollinger Bands, with the bands narrowing, indicating decreasing volatility.
Volume Analysis:
- On-Balance Volume (OBV): The OBV has been showing a slight increase, indicating buying pressure.
- Chaikin Money Flow (CMF): The CMF has been positive, indicating money flow into the stock.
Key Observations:
- The trend indicators suggest a bullish sentiment with moving averages and MACD supporting an upward trend.
- Momentum indicators show a neutral stance with RSI fluctuating and stochastic oscillators indicating a potential continuation of the current trend.
- Volatility indicators point towards decreasing volatility, potentially leading to a consolidation phase.
- Volume indicators reflect a slight increase in buying pressure, supported by positive OBV and CMF readings.
Conclusion:
Based on the analysis of the technical indicators, the next few days for TCHI stock price movement are likely to be upward with a potential for consolidation. The bullish trend supported by moving averages and MACD, along with the positive volume indicators, suggests a favorable outlook. However, the neutral momentum and decreasing volatility indicate a possible consolidation phase before a potential continuation of the upward trend. Traders and investors may consider buying opportunities during consolidation phases for potential long-term gains.