Technical Analysis of TCHP 2024-05-10
Overview:
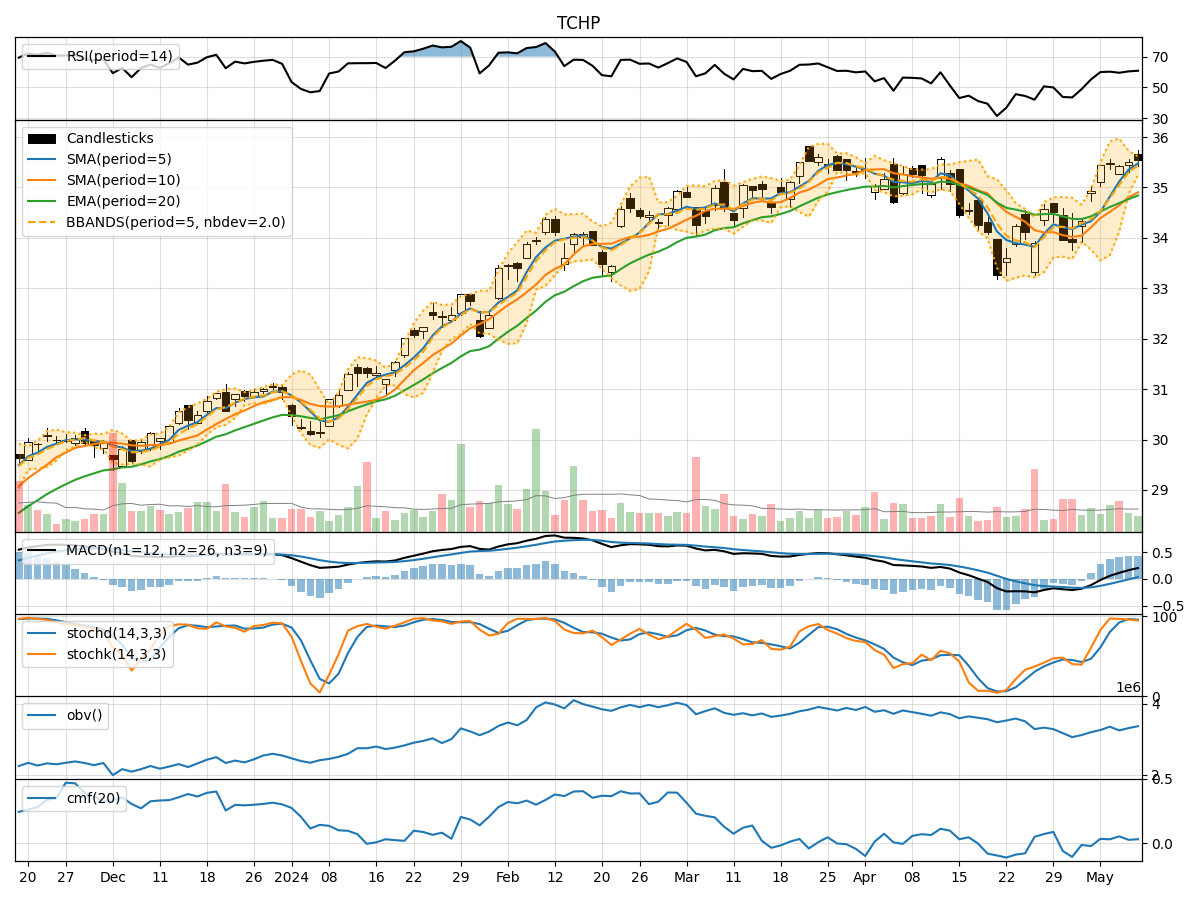
In analyzing the technical indicators for TCHP over the last 5 days, we will delve into the trends, momentum, volatility, and volume indicators to provide a comprehensive outlook on the possible stock price movement in the coming days. By examining key metrics such as moving averages, MACD, RSI, Bollinger Bands, and OBV, we aim to offer valuable insights and predictions for informed decision-making.
Trend Indicators:
- Moving Averages (MA): The 5-day MA has been consistently above the closing price, indicating a bullish trend.
- MACD: The MACD line has been consistently above the signal line, suggesting a bullish momentum.
- EMA: The EMA has been trending upwards, supporting the bullish sentiment.
Key Observation: The trend indicators point towards a bullish outlook for TCHP.
Momentum Indicators:
- RSI: The RSI has been in the neutral to slightly overbought territory, indicating moderate buying pressure.
- Stochastic Oscillator: Both %K and %D have been in the overbought zone, signaling a potential reversal.
- Williams %R: The indicator has been fluctuating around the oversold region, suggesting a mixed sentiment.
Key Observation: Momentum indicators show a mixed sentiment, with a slight bias towards a bearish reversal.
Volatility Indicators:
- Bollinger Bands: The price has been trading within the bands, indicating normal volatility.
- Bollinger %B: The %B has been fluctuating within the range, reflecting price consolidation.
- Bollinger Bandwidth: The bandwidth has been narrowing, suggesting a potential breakout.
Key Observation: Volatility indicators suggest a period of consolidation and a potential upcoming breakout.
Volume Indicators:
- On-Balance Volume (OBV): The OBV has been fluctuating, indicating indecision among investors.
- Chaikin Money Flow (CMF): The CMF has been positive but relatively flat, signaling stable money flow.
Key Observation: Volume indicators reflect indecisiveness in the market sentiment.
Conclusion:
Based on the analysis of the technical indicators, the next few days for TCHP could see a mixed price movement. The trend indicators support a bullish outlook, while momentum indicators suggest a bearish reversal might be on the horizon. Volatility indicators point towards a potential breakout from the consolidation phase, while volume indicators indicate indecisiveness among investors.
Recommendation:
Considering the overall analysis, it is advisable to proceed with caution and closely monitor the price action. Traders may consider setting tight stop-loss orders to manage risk effectively. Additionally, waiting for confirmation of a breakout or reversal from key levels could provide better trading opportunities.
Final Verdict: The next few days could see mixed price movements with a potential for both bullish and bearish scenarios. Stay vigilant and adapt your strategy accordingly to navigate the market dynamics effectively.