Technical Analysis of TDI 2024-05-10
Overview:
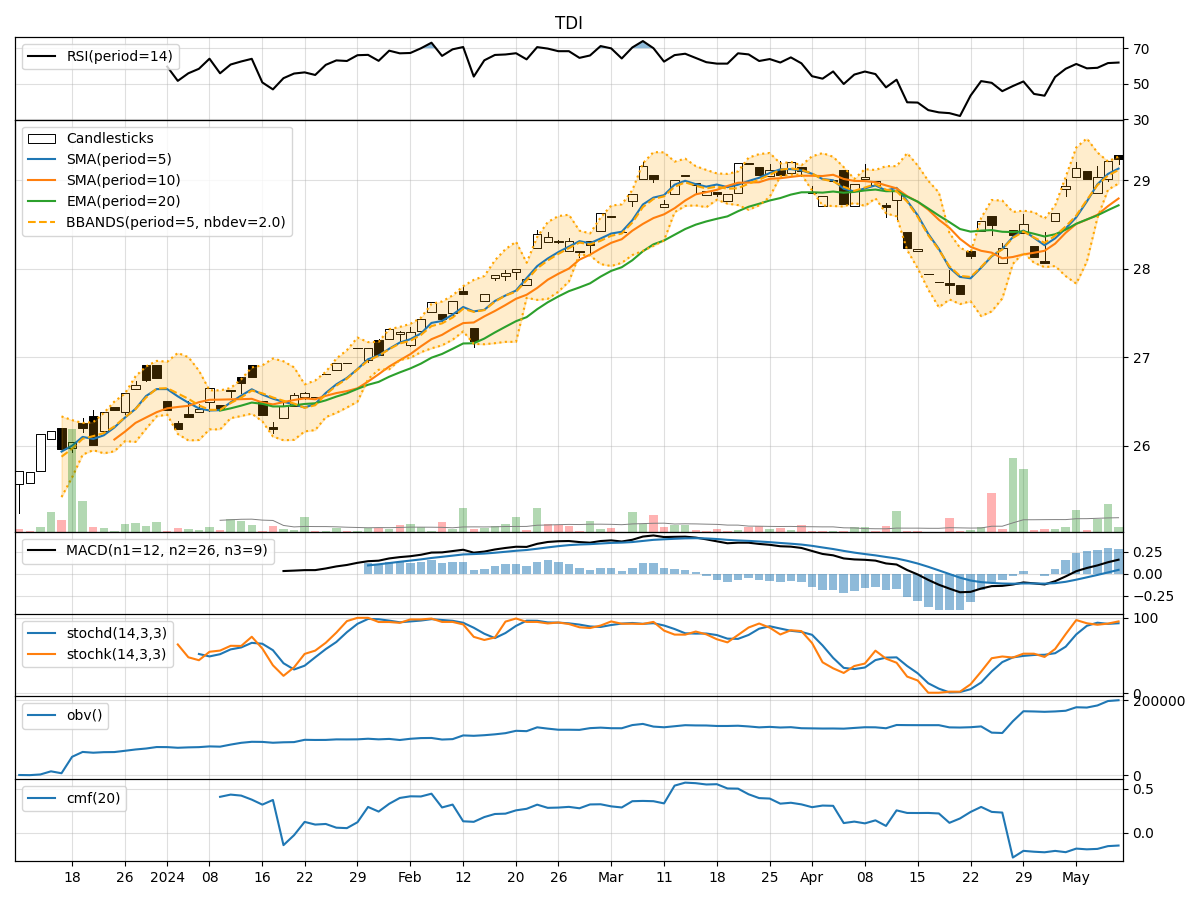
In analyzing the provided Technical Indicators (TDI) data for the last 5 days, we will delve into the trend, momentum, volatility, and volume indicators to forecast the possible stock price movement for the next few days. By examining these key indicators, we aim to provide a comprehensive and insightful analysis to guide your investment decisions.
Trend Indicators Analysis:
- Moving Averages (MA): The 5-day Moving Average (MA) has been consistently above the Simple Moving Average (SMA) and Exponential Moving Average (EMA) over the past 5 days, indicating a bullish trend.
- MACD: The Moving Average Convergence Divergence (MACD) has shown positive values, with the MACD line consistently above the Signal line, suggesting a bullish momentum in the stock price.
- Conclusion: The trend indicators point towards an upward trend in the stock price.
Momentum Indicators Analysis:
- RSI: The Relative Strength Index (RSI) has been fluctuating around the 60-70 range, indicating a neutral momentum in the stock.
- Stochastic Oscillator: Both %K and %D values of the Stochastic Oscillator are in the overbought zone, suggesting a potential reversal or consolidation.
- Williams %R: The Williams %R is hovering around the oversold territory, indicating a possible buying opportunity.
- Conclusion: The momentum indicators suggest a mixed sentiment with a potential for a reversal or consolidation in the stock price.
Volatility Indicators Analysis:
- Bollinger Bands: The Bollinger Bands are narrowing, indicating decreasing volatility in the stock price.
- Conclusion: The volatility indicators suggest a decreasing volatility in the stock price, potentially leading to a sideways movement.
Volume Indicators Analysis:
- On-Balance Volume (OBV): The OBV has shown a slight increase over the past 5 days, indicating a positive volume flow.
- Chaikin Money Flow (CMF): The CMF is negative, suggesting a bearish pressure on the stock.
- Conclusion: The volume indicators present a mixed signal with a slight positive volume flow but overall bearish pressure.
Overall Conclusion:
Based on the analysis of trend, momentum, volatility, and volume indicators, the next few days' possible stock price movement is likely to be sideways with a potential for consolidation. While the trend indicators suggest an upward trend, the momentum indicators indicate a mixed sentiment with a possibility of a reversal or consolidation. The decreasing volatility and mixed volume indicators further support the view of a sideways movement in the stock price.
Recommendation:
Considering the comprehensive analysis of the technical indicators, it is advisable to monitor the stock closely for any signs of a breakout or reversal. Traders may consider implementing range-bound strategies to capitalize on potential price fluctuations within the sideways movement. Additionally, it is crucial to stay informed about any external factors that may impact the stock price movement.
By staying vigilant and adapting to changing market conditions, investors can make well-informed decisions to navigate the upcoming stock price movements effectively.