Technical Analysis of TDSC 2024-05-10
Overview:
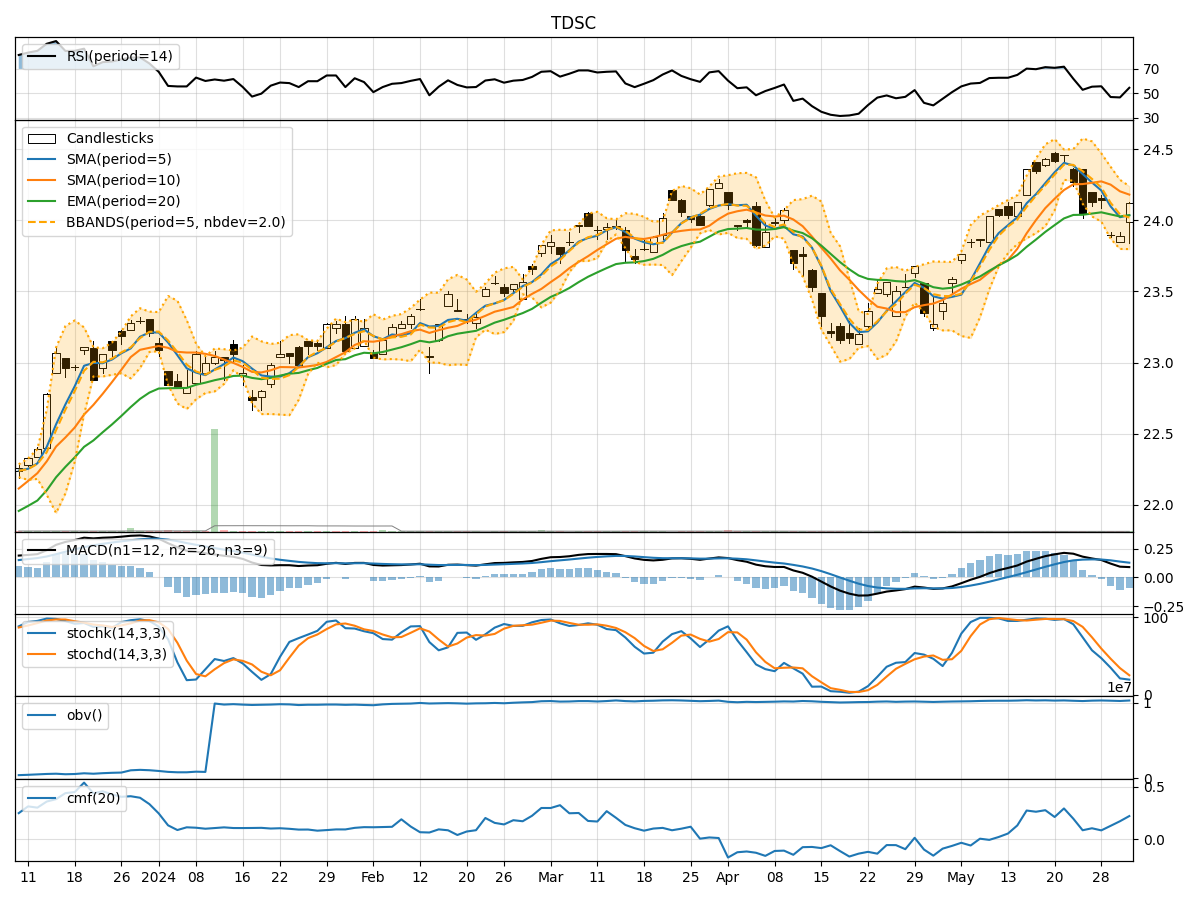
In the last 5 trading days, the stock has shown a consistent uptrend in terms of closing prices. The moving averages (MA) have been trending upwards, indicating a positive momentum. The MACD and RSI have also been increasing, suggesting bullish momentum. However, the stock is currently trading near the upper Bollinger Band, indicating potential overbought conditions.
Trend Indicators Analysis:
- Moving Averages (MA): The 5-day MA has been consistently above the 10-day simple moving average (SMA), indicating a short-term bullish trend. The exponential moving average (EMA) has also been trending upwards, supporting the bullish sentiment.
- MACD: The MACD line has been above the signal line for the past 5 days, with both lines showing an upward trend. This suggests strong bullish momentum.
- MACD Histogram: The MACD histogram has been increasing, indicating an acceleration of the bullish trend.
Momentum Indicators Analysis:
- RSI: The Relative Strength Index (RSI) has been increasing and is currently in the overbought territory above 70. This suggests that the stock may be overvalued in the short term.
- Stochastic Oscillator: Both %K and %D lines of the Stochastic Oscillator are in the overbought zone, indicating a potential reversal or consolidation in the near future.
- Williams %R: The Williams %R is also in the overbought region, signaling a possible pullback.
Volatility Indicators Analysis:
- Bollinger Bands: The stock price has been trading near the upper Bollinger Band, indicating high volatility and potential overbought conditions. A breakout above the upper band may signal further upside momentum.
- Bollinger %B: The %B indicator is above 0.8, suggesting that the stock is trading at the upper end of its recent price range.
Volume Indicators Analysis:
- On-Balance Volume (OBV): The OBV has been increasing over the past 5 days, indicating strong buying pressure. This aligns with the price appreciation during the same period.
- Chaikin Money Flow (CMF): The CMF has been fluctuating around the zero line, indicating a balance between buying and selling pressure over the past 20 days.
Conclusion:
Based on the technical indicators and analysis: - Trend: The stock is in a strong upward trend supported by moving averages and MACD. - Momentum: The momentum indicators suggest overbought conditions, indicating a potential reversal or consolidation. - Volatility: High volatility near the upper Bollinger Band may lead to a pullback or consolidation. - Volume: Strong buying pressure indicated by OBV supports the bullish trend.
Overall Assessment:
- Short-Term: The stock may experience a short-term pullback or consolidation due to overbought conditions indicated by momentum and volatility indicators.
- Long-Term: The overall trend remains bullish, but investors should be cautious of potential profit-taking or a temporary reversal in the near future.
Conclusion:
Based on the analysis, the stock is likely to experience a short-term pullback or consolidation before potentially resuming its long-term bullish trend. Investors should monitor key support levels and be prepared for increased volatility in the coming days.