Technical Analysis of TDTT 2024-05-10
Overview:
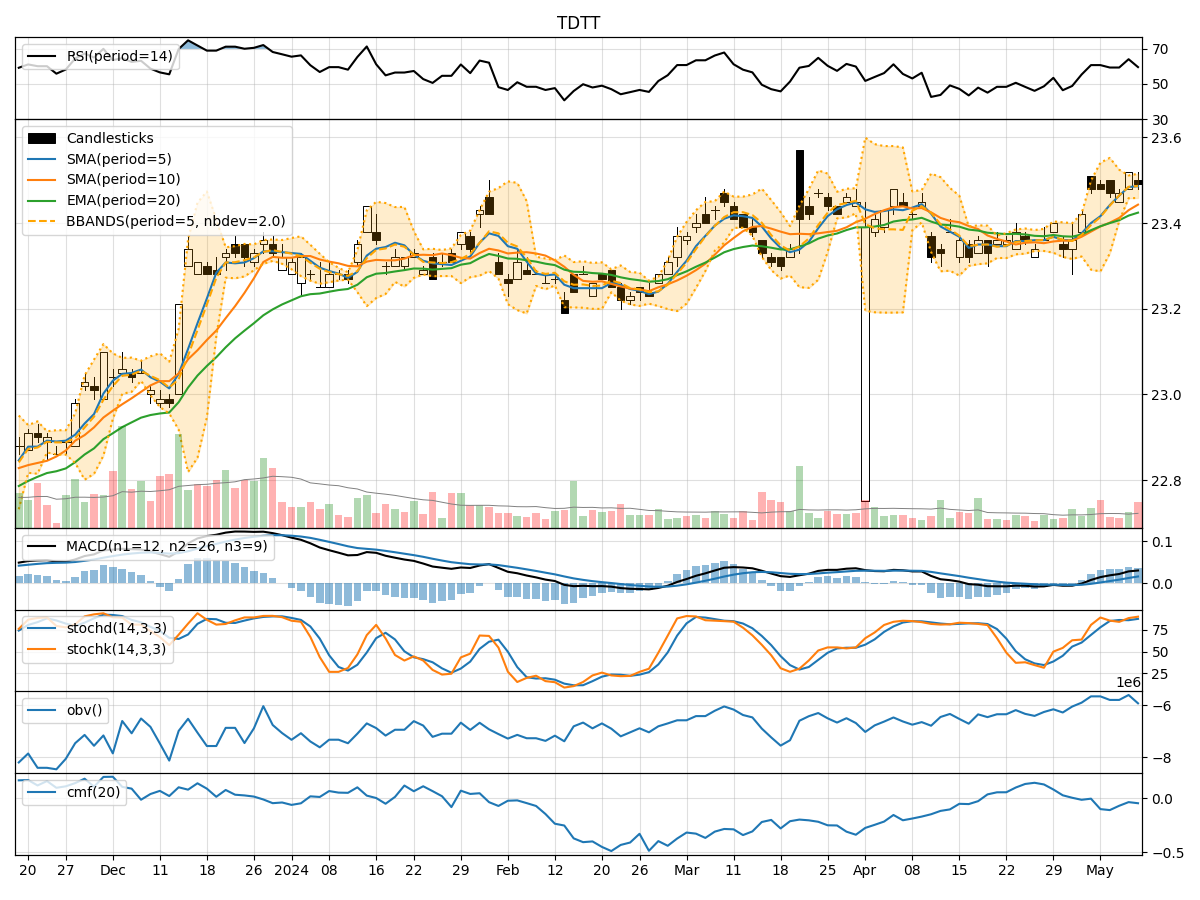
In the last 5 trading days, the stock has shown relatively stable price movements with minor fluctuations. The trend indicators suggest a slight uptrend, supported by the moving averages and MACD values. Momentum indicators indicate a neutral to slightly bullish sentiment, with RSI values hovering around the mid-range. Volatility indicators show a narrowing of the Bollinger Bands, indicating decreasing volatility. Volume indicators suggest a slight decrease in buying pressure.
Trend Indicators:
- Moving Averages (MA): The 5-day MA has been consistently above the closing prices, indicating a short-term uptrend.
- MACD: The MACD line has been above the signal line, showing positive momentum.
- EMA: The EMA values have been gradually increasing, supporting the uptrend.
Momentum Indicators:
- RSI: The RSI values have been fluctuating around 60, indicating a neutral sentiment with a slight bullish bias.
- Stochastic Oscillator: Both %K and %D values have been in the overbought zone, suggesting a potential reversal or consolidation.
- Williams %R: The Williams %R values have been fluctuating around the oversold region, indicating a potential buying opportunity.
Volatility Indicators:
- Bollinger Bands (BB): The narrowing of the Bollinger Bands suggests decreasing volatility and a possible period of consolidation.
- BB% (BB Percentage): The BB% values have been decreasing, indicating a compression in price movement.
Volume Indicators:
- On-Balance Volume (OBV): The OBV values have been relatively stable, indicating a balance between buying and selling pressure.
- Chaikin Money Flow (CMF): The CMF values have been negative, suggesting a decrease in buying pressure.
Key Observations:
- The stock is currently in a short-term uptrend supported by moving averages and MACD.
- Momentum indicators show a neutral to slightly bullish sentiment.
- Volatility is decreasing, indicating a potential period of consolidation.
- Volume indicators suggest a slight decrease in buying pressure.
Conclusion:
Based on the analysis of the technical indicators, the next few days' possible stock price movement is likely to be sideways or consolidating. The stock may trade within a narrow range as volatility decreases and buying pressure stabilizes. Traders should watch for a breakout above key resistance levels or a breakdown below support levels to confirm the next directional move. It is advisable to wait for a clear signal before taking any significant trading positions.