Technical Analysis of TDV 2024-05-10
Overview:
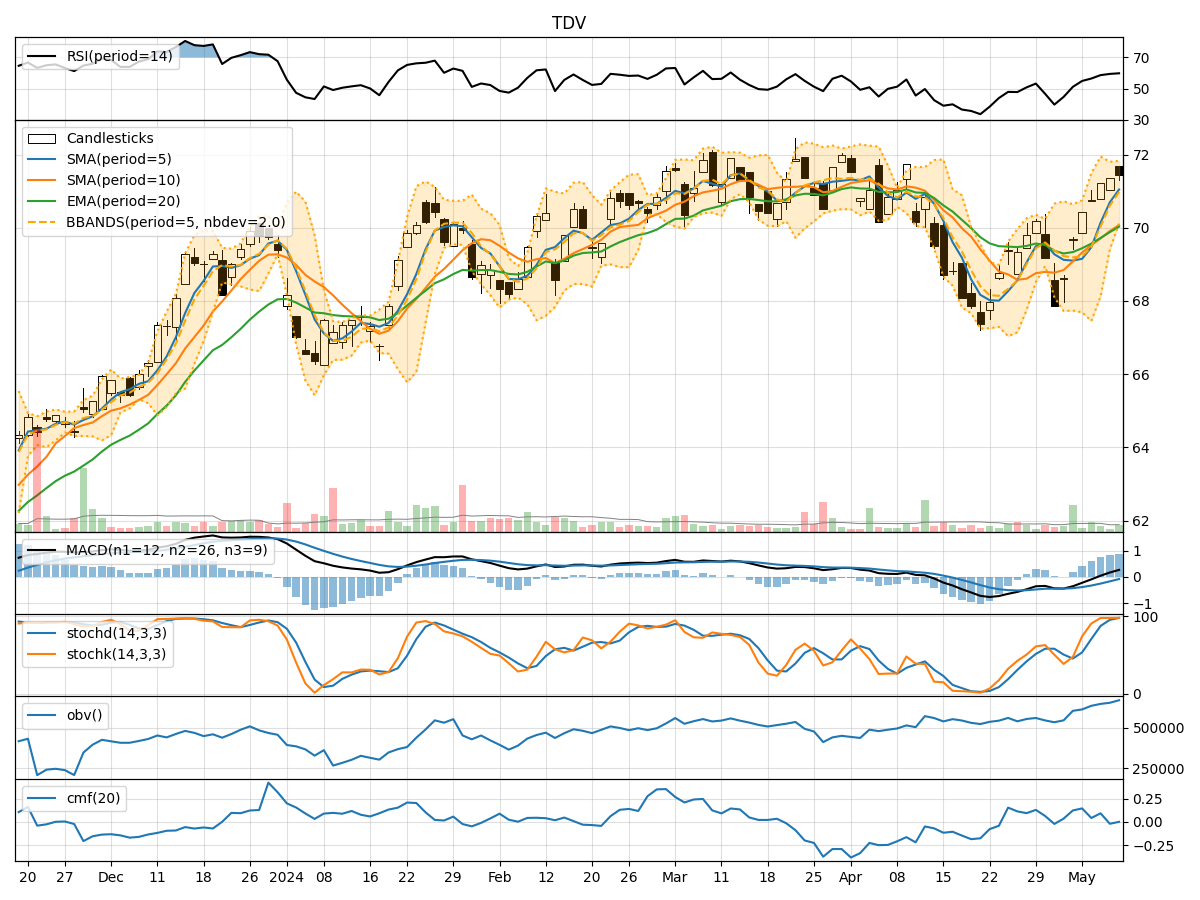
In the last 5 trading days, the stock price of TDV has shown a consistent uptrend, supported by increasing moving averages, positive MACD values, rising RSI, and expanding Bollinger Bands. The volume has also been relatively stable, with a slight increase in the On-Balance Volume (OBV) and a positive Chaikin Money Flow (CMF). Momentum indicators like Stochastic Oscillator and Williams %R suggest overbought conditions but do not indicate an immediate reversal.
Trend Analysis:
- Moving Averages (MA): The 5-day MA has been consistently above the 10-day SMA, indicating a short-term bullish trend. The EMA(20) has been steadily increasing, supporting the uptrend.
- MACD: The MACD line has been above the signal line for the past 5 days, with both lines in positive territory. The MACD Histogram has been expanding, indicating increasing bullish momentum.
Momentum Analysis:
- RSI: The RSI has been trending upwards, currently in the neutral zone around 60. This suggests there is room for further upside potential before reaching overbought levels.
- Stochastic Oscillator: Both %K and %D lines of the Stochastic Oscillator are in the overbought zone, indicating a potential pullback or consolidation in the short term.
- Williams %R: The Williams %R is also in the overbought territory, suggesting a possible reversal or correction.
Volatility Analysis:
- Bollinger Bands (BB): The Bollinger Bands have been widening, indicating increased volatility. The price has been riding the upper band, which could signal a potential overextension and a reversion to the mean.
Volume Analysis:
- On-Balance Volume (OBV): The OBV has been trending upwards, indicating accumulation by investors. This supports the bullish price movement.
- Chaikin Money Flow (CMF): The CMF has been positive, suggesting that money is flowing into the stock. This aligns with the uptrend in price.
Key Observations:
- The stock is currently in a strong uptrend, supported by various technical indicators.
- Momentum indicators suggest a potential short-term pullback or consolidation due to overbought conditions.
- Volatility has been increasing, which could lead to sharper price movements.
- Volume indicators show positive accumulation and money flow into the stock.
Conclusion:
Based on the technical analysis of TDV stock: - Short-Term View: The stock may experience a short-term pullback or consolidation due to overbought conditions indicated by momentum indicators. - Medium- to Long-Term View: The overall trend remains bullish, supported by moving averages, MACD, and volume indicators. Investors should consider using any short-term weakness as a buying opportunity to participate in the ongoing uptrend.
Recommendation:
- Hold/Buy: Investors holding the stock can continue to hold with a long-term perspective. Consider buying on dips for potential accumulation.
- Risk Management: Traders looking to enter new positions should wait for a pullback or consolidation before initiating trades to manage risk effectively.
This analysis provides a comprehensive view of the technical indicators and their implications for the future price movement of TDV stock. It is essential to monitor the evolving market conditions and adjust strategies accordingly to capitalize on potential opportunities.