Technical Analysis of TDVG 2024-05-10
Overview:
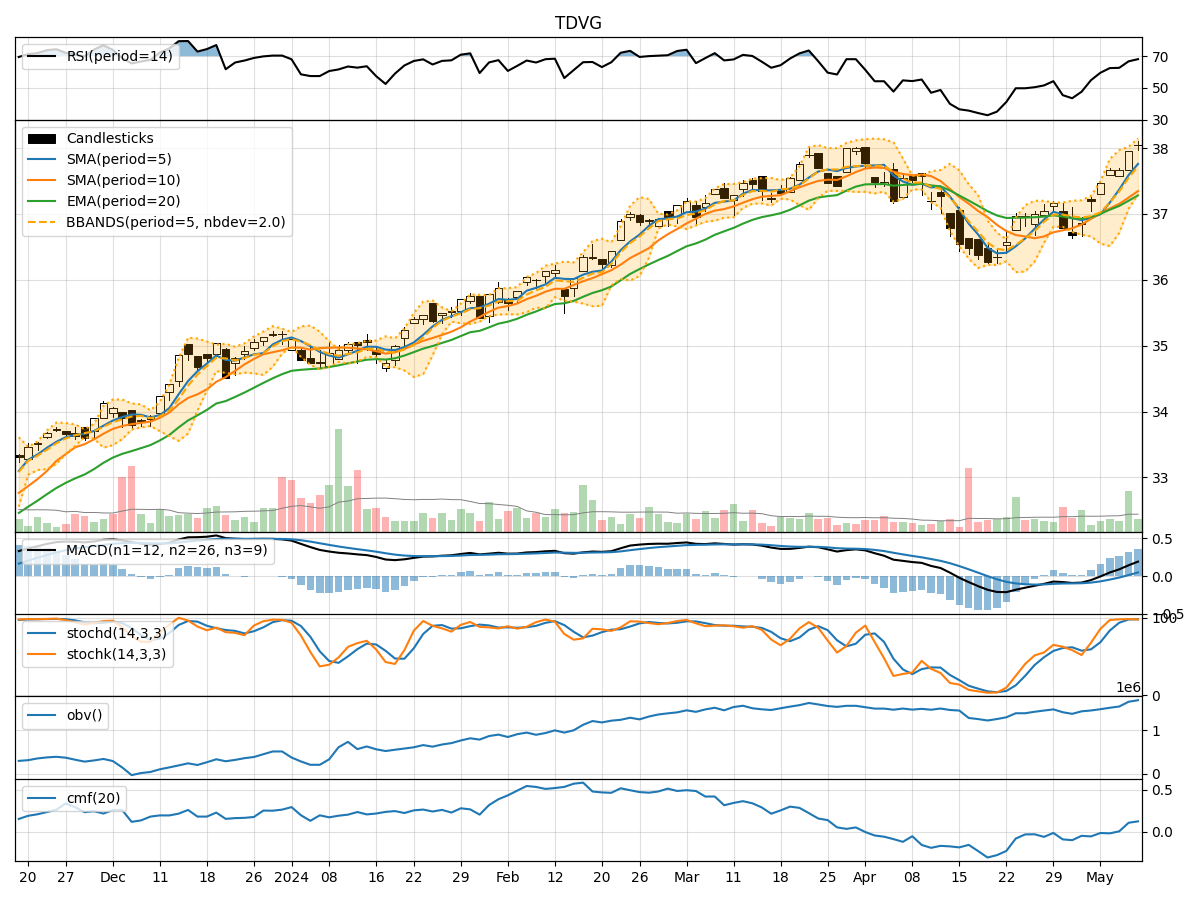
In the last 5 trading days, TDVG stock has shown a consistent uptrend in both price and volume. The moving averages have been trending upwards, indicating a bullish sentiment. Momentum indicators like RSI and Stochastic oscillators suggest the stock is in overbought territory but still showing strength. Volatility indicators show a narrowing of Bollinger Bands, indicating potential consolidation. Volume indicators like OBV and CMF suggest accumulation by investors.
Trend Indicators:
- Moving Averages (MA): The 5-day MA has been consistently above the 10-day SMA, indicating a short-term bullish trend. The EMA(20) is also trending upwards, supporting the bullish sentiment.
- MACD: The MACD line has been above the signal line for the past 5 days, indicating positive momentum. The MACD histogram has been increasing, showing strengthening bullish momentum.
Momentum Indicators:
- RSI: The RSI has been in the overbought zone for the last few days, indicating a strong bullish momentum. However, an overbought RSI could also signal a potential reversal or correction.
- Stochastic Oscillators: Both %K and %D have been in the overbought zone, suggesting a strong upward momentum. However, being in the overbought zone for an extended period may lead to a reversal.
Volatility Indicators:
- Bollinger Bands (BB): The narrowing of the Bollinger Bands suggests decreasing volatility and a potential period of consolidation. A breakout from this consolidation phase could indicate the next directional move.
- Bollinger Band %B (BBP): The %B is currently below 1, indicating the price is trading below the lower Bollinger Band, which could signal an oversold condition.
Volume Indicators:
- On-Balance Volume (OBV): The OBV has been steadily increasing over the last 5 days, indicating strong buying pressure and accumulation by investors.
- Chaikin Money Flow (CMF): The CMF has been positive, indicating that money is flowing into the stock. This supports the bullish sentiment seen in other indicators.
Conclusion:
Based on the analysis of the technical indicators, the next few days are likely to see continued bullish momentum in TDVG stock. The uptrend in moving averages, positive MACD, and strong buying pressure indicated by volume indicators support this view. However, caution is advised as the stock is currently in overbought territory according to RSI and Stochastic oscillators. Expect a potential consolidation phase before a possible continuation of the uptrend. Traders should closely monitor the Bollinger Bands for a breakout signal to confirm the next directional move.