Technical Analysis of TDVI 2024-05-10
Overview:
In analyzing the provided TDVI TA data for the last 5 days, we will delve into the technical indicators across trend, momentum, volatility, and volume to forecast the possible stock price movement in the upcoming days. By examining key metrics and patterns, we aim to provide a comprehensive and insightful prediction for the stock's future direction.
Trend Analysis:
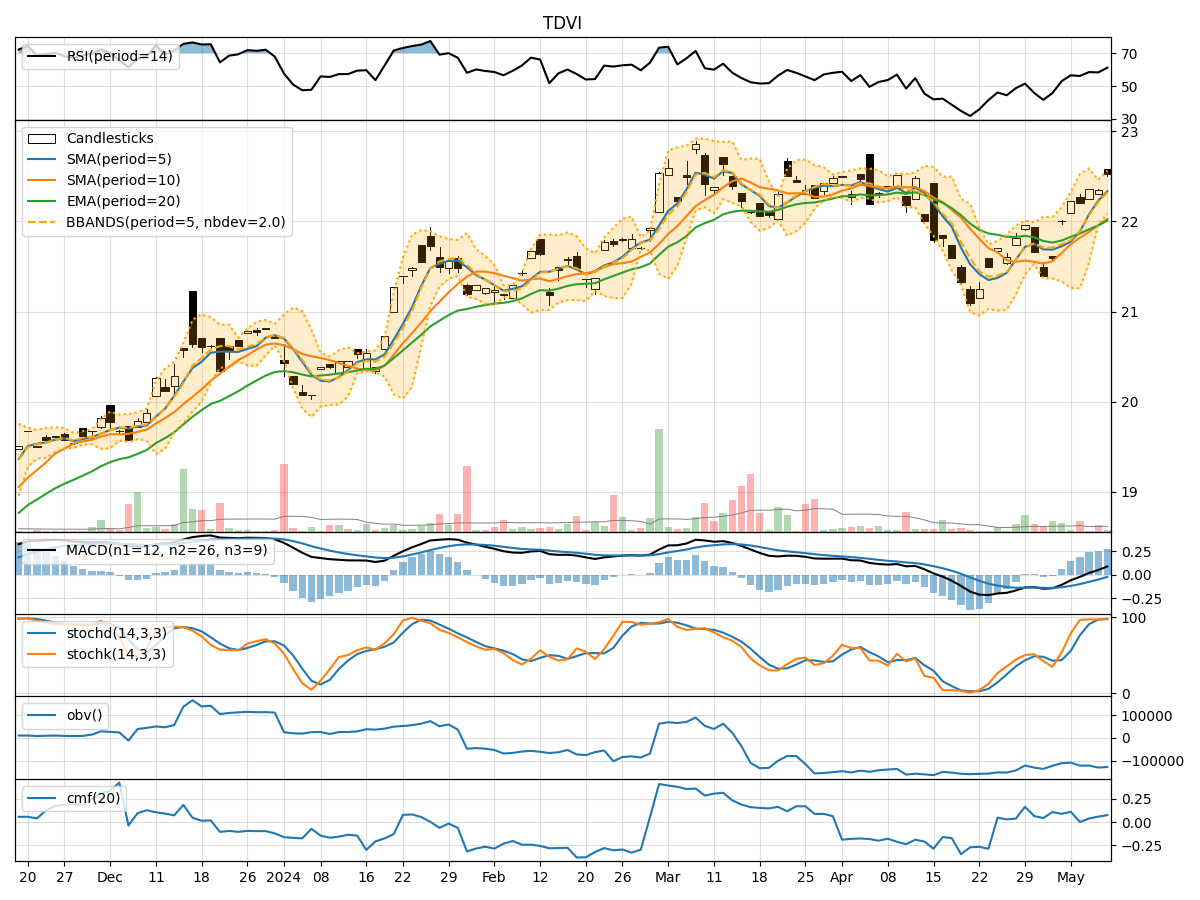
- Moving Averages (MA): The 5-day MA has been consistently rising, indicating a bullish trend in the short term.
- MACD: The MACD line has been above the signal line, suggesting a bullish momentum.
- EMA: The EMA has been trending upwards, supporting the bullish sentiment in the stock.
Momentum Analysis:
- RSI: The RSI values have been in the neutral to slightly overbought territory, indicating a balanced momentum.
- Stochastic Oscillator: Both %K and %D have been in the overbought zone, signaling a potential reversal or consolidation.
- Williams %R: The Williams %R has been fluctuating around the oversold region, suggesting a mixed momentum.
Volatility Analysis:
- Bollinger Bands (BB): The stock price has been trading within the bands, indicating moderate volatility.
- BB Width: The width of the bands has been relatively stable, suggesting consistent price movement.
- BB %B: The %B indicator has been hovering around the midline, reflecting a neutral volatility outlook.
Volume Analysis:
- On-Balance Volume (OBV): The OBV has shown a slight decline, indicating some distribution in the stock.
- Chaikin Money Flow (CMF): The CMF has been positive, suggesting buying pressure in the stock over the past 20 days.
Key Observations:
- The trend indicators point towards a bullish sentiment in the stock, supported by moving averages and MACD.
- Momentum indicators show a mixed picture with RSI neutral, Stochastic overbought, and Williams %R fluctuating.
- Volatility remains moderate with the stock trading within Bollinger Bands.
- Volume indicators indicate a slight distribution but overall positive buying pressure.
Conclusion:
Based on the analysis of the technical indicators, the stock is likely to experience further upward movement in the next few days. The bullish trend supported by moving averages and MACD, coupled with moderate volatility and positive buying pressure, suggests a favorable outlook for the stock price. Traders and investors may consider buying opportunities in the stock based on the current technical signals.