Technical Analysis of TECB 2024-05-10
Overview:
In analyzing the technical indicators for TECB over the last 5 days, we will delve into the trend, momentum, volatility, and volume indicators to provide a comprehensive outlook on the possible stock price movement in the coming days. By examining these key aspects, we aim to offer valuable insights and predictions for potential investors.
Trend Analysis:
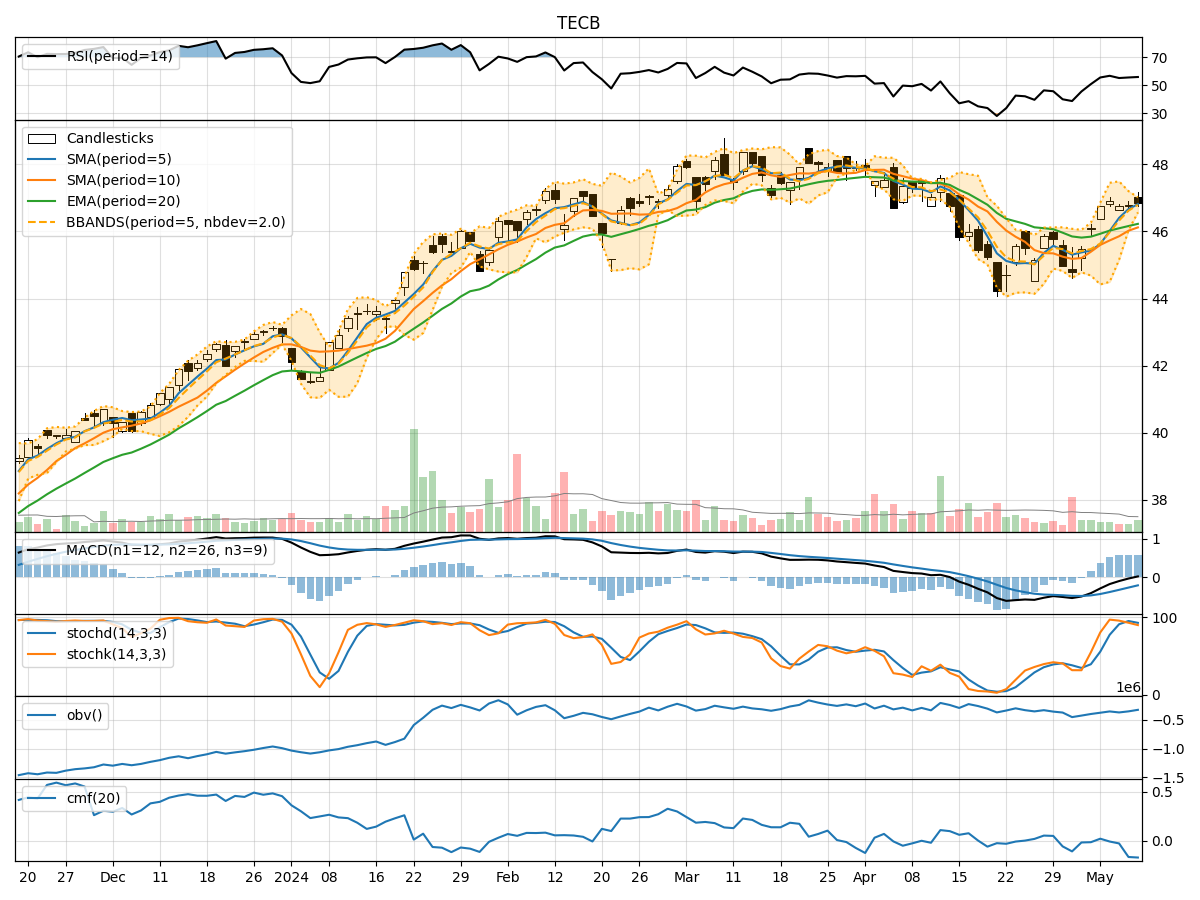
- Moving Averages (MA): The 5-day Moving Average (MA) has been consistently above the Simple Moving Average (SMA) and Exponential Moving Average (EMA), indicating a bullish trend.
- MACD: The MACD line has been positive, with the MACD Histogram showing an increasing trend, suggesting upward momentum.
Momentum Analysis:
- RSI: The Relative Strength Index (RSI) has been hovering around the neutral zone, indicating a balanced momentum.
- Stochastic Oscillator: Both %K and %D have been gradually decreasing, signaling a potential reversal in momentum.
Volatility Analysis:
- Bollinger Bands (BB): The stock price has been trading within the Bollinger Bands, with the bands narrowing, suggesting reduced volatility.
Volume Analysis:
- On-Balance Volume (OBV): The OBV has shown mixed signals, with fluctuations in volume accumulation.
- Chaikin Money Flow (CMF): The CMF has been negative, indicating selling pressure in the market.
Key Observations:
- The trend indicators suggest a bullish sentiment in the short term.
- Momentum indicators show a potential shift in momentum towards a bearish direction.
- Volatility indicators point towards a decrease in price fluctuations.
- Volume indicators reflect uncertainty in market participation and sentiment.
Conclusion:
Based on the analysis of the technical indicators, the next few days' possible stock price movement for TECB is likely to experience a short-term consolidation phase. While the trend indicators remain bullish, the momentum indicators signal a potential reversal in momentum towards a bearish direction. The decreasing volatility and mixed volume signals further support the view of a consolidation phase.
Recommendation:
- Short-term Traders: Consider taking profits or tightening stop-loss levels as the stock enters a consolidation phase.
- Long-term Investors: Monitor the price action closely for potential entry points or accumulation opportunities during the consolidation period.
Disclaimer:
This analysis is based solely on technical indicators and historical data, and it is essential to consider other fundamental factors and market dynamics before making any investment decisions. Consulting with a financial advisor or conducting further research is recommended to align investment strategies with individual goals and risk tolerance levels.