Technical Analysis of TEQI 2024-05-10
Overview:
In analyzing the technical indicators for TEQI over the last 5 days, we will delve into the trend, momentum, volatility, and volume indicators to provide a comprehensive outlook on the possible stock price movement in the coming days. By examining these key aspects, we aim to offer valuable insights and predictions to guide your investment decisions.
Trend Indicators:
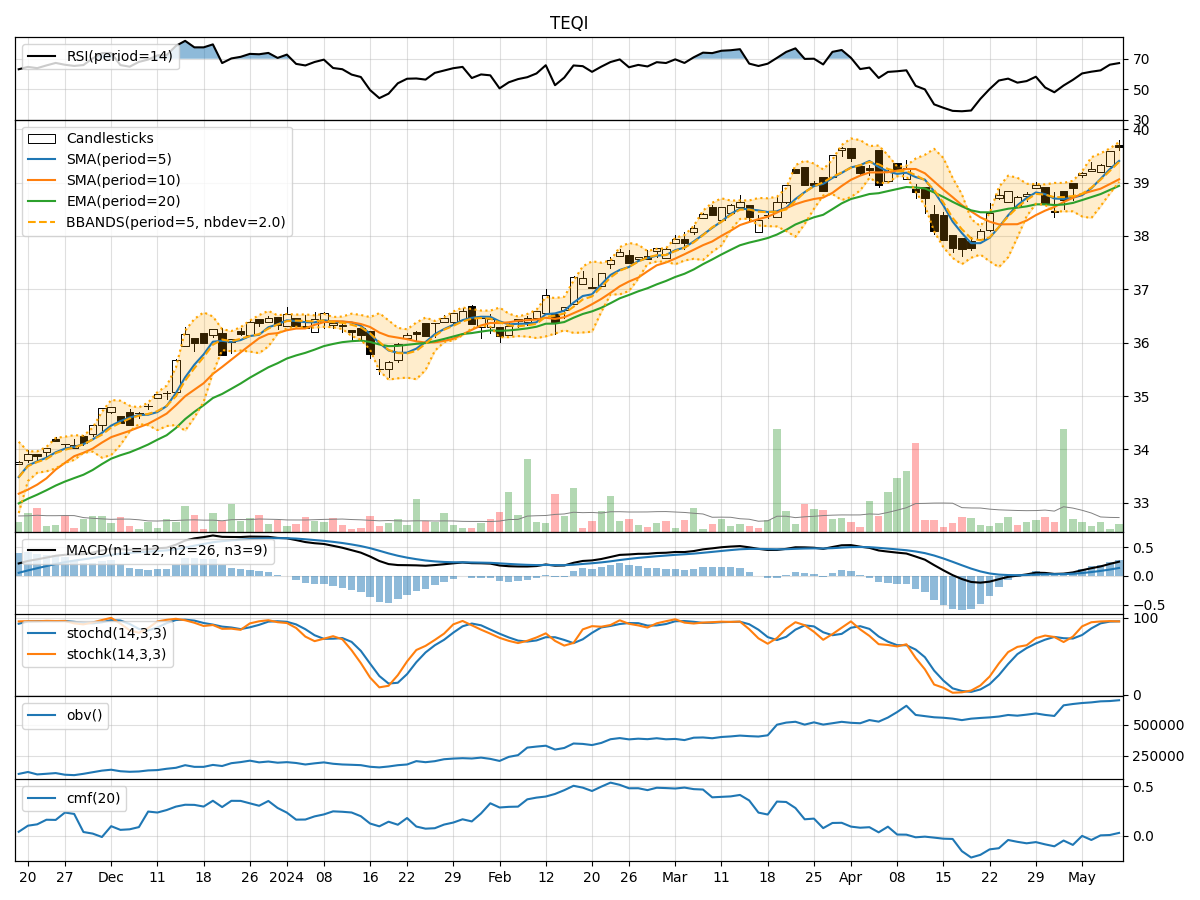
- Moving Averages (MA): The moving averages have been showing a consistent uptrend over the past 5 days, with the closing prices consistently above the short-term moving averages.
- MACD: The MACD line has been steadily increasing, indicating a strengthening bullish momentum in the stock.
- EMA: The exponential moving average has been trending upwards, reflecting a positive price trend.
Momentum Indicators:
- RSI: The Relative Strength Index has been gradually increasing, suggesting that the stock is in an overbought territory but still has room for further upside potential.
- Stochastic Oscillator: Both %K and %D lines of the stochastic oscillator have been in the overbought zone, indicating a strong bullish momentum.
- Williams %R: The Williams %R is in the oversold region, signaling a potential reversal in the stock price.
Volatility Indicators:
- Bollinger Bands: The Bollinger Bands have been widening, indicating increased volatility in the stock price.
- Bollinger %B: The %B indicator has been fluctuating within a range, suggesting potential price reversals or breakouts.
Volume Indicators:
- On-Balance Volume (OBV): The OBV has been showing a slight increase, indicating a positive accumulation of the stock.
- Chaikin Money Flow (CMF): The CMF has been hovering around the zero line, suggesting a balance between buying and selling pressure.
Conclusion:
Based on the analysis of the technical indicators, the stock of TEQI is exhibiting strong bullish signals across various aspects. The trend indicators, momentum indicators, and volume indicators all point towards a continuation of the upward trend in the stock price. The increasing moving averages, rising MACD line, and overbought levels in the RSI and stochastic oscillator indicate a potential for further price appreciation.
Overall Assessment:
- Outlook: Bullish
- Recommendation: Considering the positive momentum and trend in the stock, it is likely that TEQI will continue its upward trajectory in the coming days. Investors may consider holding or even adding to their positions to capitalize on the potential price appreciation.
Disclaimer:
Please note that while technical analysis provides valuable insights, market conditions can change rapidly, and it is essential to monitor the stock closely for any deviations from the current trend. Additionally, external factors such as market news or economic events can also impact stock prices. It is advisable to conduct further research and consult with a financial advisor before making any investment decisions.