Technical Analysis of TFLO 2024-05-10
Overview:
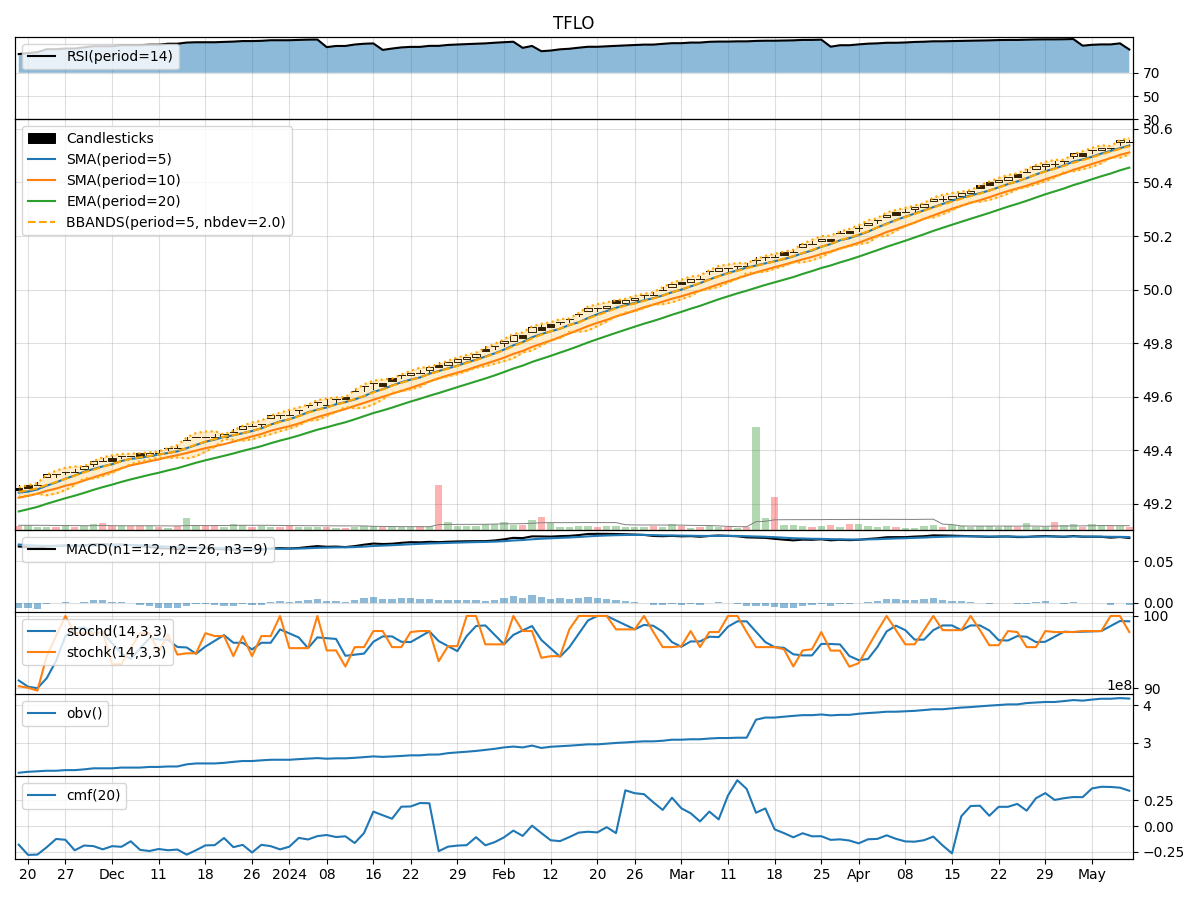
In analyzing the technical indicators for TFLO over the last 5 days, we will delve into the trend, momentum, volatility, and volume indicators to provide a comprehensive outlook on the possible stock price movement in the coming days.
Trend Indicators:
- Moving Averages (MA): The 5-day MA has been consistently above the closing price, indicating a short-term uptrend.
- MACD: The MACD line has been positive, albeit showing a slight decrease over the last few days.
- EMA: The EMA has been steadily increasing, reflecting a bullish sentiment in the stock.
Momentum Indicators:
- RSI: The RSI has been in the overbought territory, suggesting a strong bullish momentum.
- Stochastic Oscillator: Both %K and %D have been high, indicating a strong upward momentum.
- Williams %R: The indicator has been in the oversold region, signaling a potential reversal.
Volatility Indicators:
- Bollinger Bands (BB): The bands have been relatively narrow, indicating low volatility in the stock price.
- BB %B: The %B has been hovering around 0.7, suggesting a neutral stance in terms of volatility.
Volume Indicators:
- On-Balance Volume (OBV): The OBV has shown a slight increase, indicating accumulation by investors.
- Chaikin Money Flow (CMF): The CMF has been positive, reflecting buying pressure in the stock.
Key Observations:
- The trend indicators suggest a bullish sentiment in the short term, supported by the moving averages and EMA.
- Momentum indicators indicate a strong bullish momentum, with RSI in the overbought region and stochastic oscillators showing high levels.
- Volatility remains low, as indicated by the narrow Bollinger Bands, suggesting a lack of significant price fluctuations.
- Volume indicators show a slight increase in accumulation and positive buying pressure.
Conclusion:
Based on the analysis of the technical indicators, the stock is likely to continue its upward movement in the coming days. The bullish trend supported by the moving averages and EMA, coupled with strong momentum indicators and positive volume accumulation, indicates a favorable outlook for TFLO. Investors may consider holding or even adding to their positions based on the current technical analysis.