Technical Analysis of TFLR 2024-05-10
Overview:
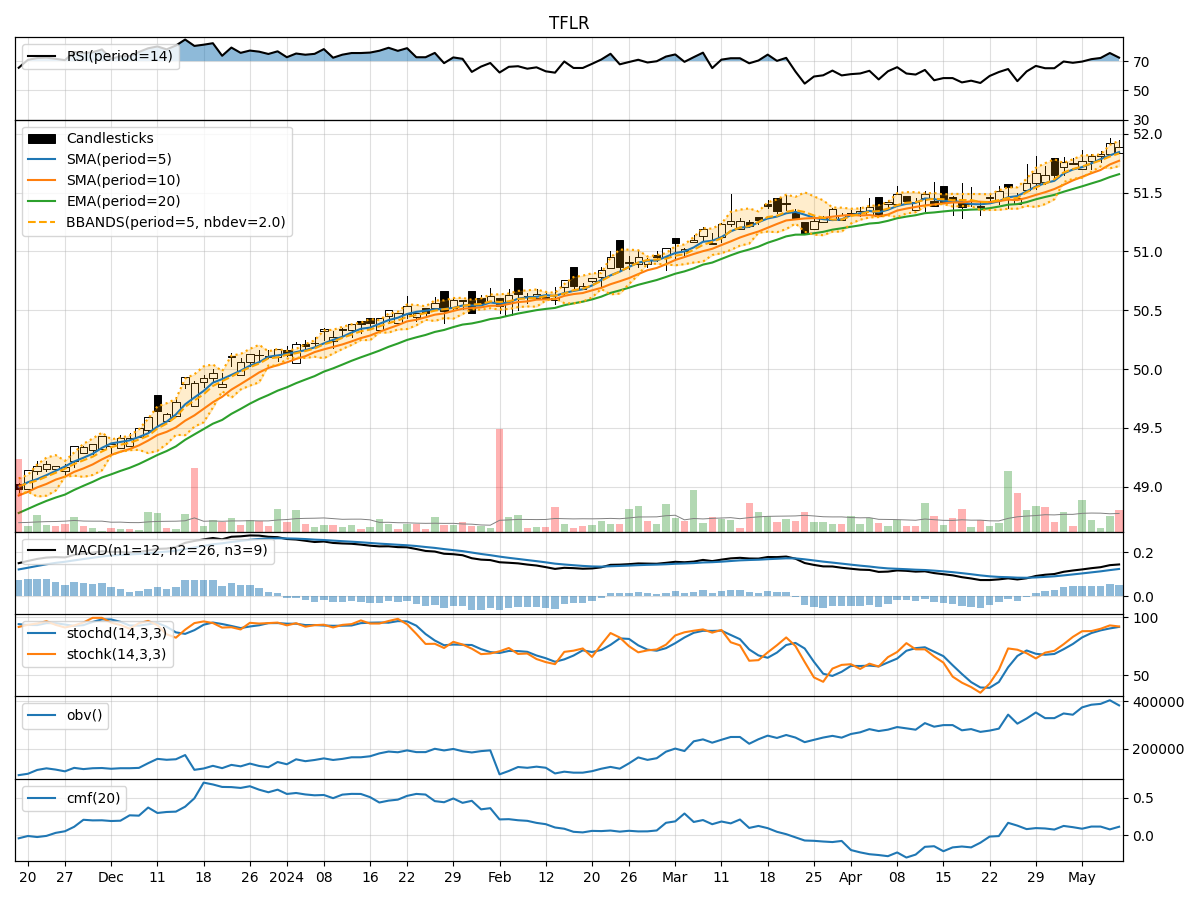
In analyzing the technical indicators for TFLR over the last 5 days, we will delve into the trend, momentum, volatility, and volume indicators to provide a comprehensive outlook on the possible stock price movement in the coming days.
Trend Analysis:
- Moving Averages (MA): The 5-day MA has been consistently above the closing prices, indicating a short-term uptrend.
- MACD: The MACD line has been above the signal line, suggesting bullish momentum.
- EMA: The EMA has been trending upwards, supporting the bullish sentiment.
Momentum Analysis:
- RSI: The RSI has been in the overbought territory, indicating strong buying pressure.
- Stochastic Oscillator: Both %K and %D have been in the overbought zone, signaling a potential reversal.
- Williams %R: The indicator has been in the oversold region, suggesting a possible price reversal.
Volatility Analysis:
- Bollinger Bands (BB): The stock price has been trading within the bands, indicating stable volatility.
- BB Width: The bands have been relatively narrow, suggesting a period of consolidation.
- BB %B: The %B indicator has been fluctuating around the midline, indicating a balanced market sentiment.
Volume Analysis:
- On-Balance Volume (OBV): The OBV has shown mixed signals, with fluctuations in volume accumulation.
- Chaikin Money Flow (CMF): The CMF has been positive but fluctuating, indicating uncertainty in buying pressure.
Key Observations:
- The trend indicators suggest a bullish bias in the short term.
- Momentum indicators show conflicting signals with overbought conditions.
- Volatility remains stable with a slight inclination towards consolidation.
- Volume indicators reflect mixed signals with no clear trend in volume accumulation.
Conclusion:
Based on the analysis of the technical indicators, the next few days for TFLR could see further upside potential in the stock price. However, caution is advised due to the conflicting signals from momentum indicators, which may lead to a short-term correction before resuming the uptrend. The overall outlook remains bullish, but investors should closely monitor key support and resistance levels for potential entry or exit points.