Technical Analysis of TFPN 2024-05-10
Overview:
In analyzing the provided Technical Analysis (TA) data for the last 5 days, we will delve into the trend, momentum, volatility, and volume indicators to forecast the possible stock price movement for the next few days. By examining these key indicators, we aim to provide a comprehensive and insightful prediction backed by data-driven analysis.
Trend Indicators:
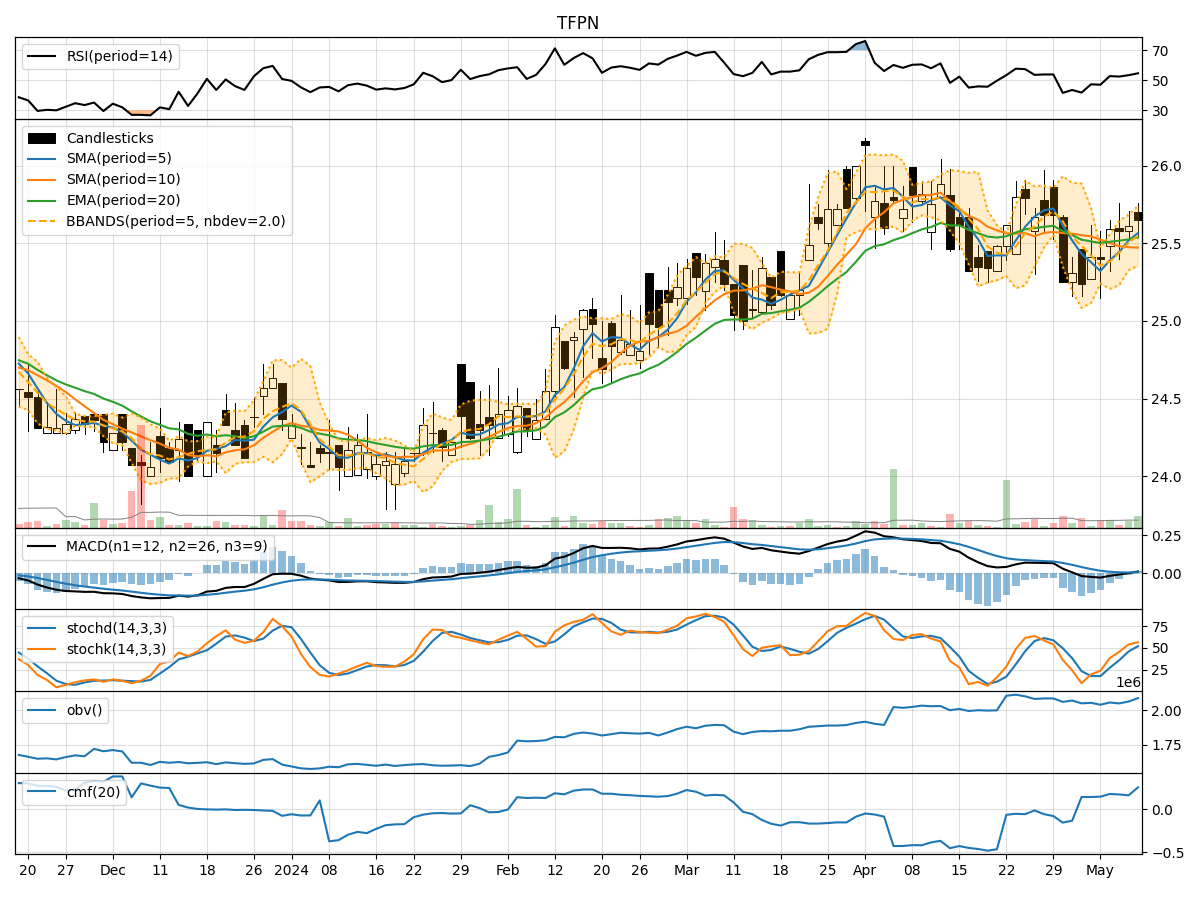
- Moving Averages (MA): The 5-day Moving Average (MA) has been showing an upward trend, indicating a positive momentum in the stock price.
- MACD: The Moving Average Convergence Divergence (MACD) has been gradually increasing, with the MACD line crossing above the signal line, suggesting a bullish signal.
- EMA: The Exponential Moving Average (EMA) has been on an upward trajectory, further supporting the bullish outlook.
Momentum Indicators:
- RSI: The Relative Strength Index (RSI) has been consistently rising, indicating increasing buying pressure and potential for further price appreciation.
- Stochastic Oscillator: Both %K and %D lines of the Stochastic Oscillator are in the overbought territory, suggesting a strong bullish momentum.
- Williams %R: The Williams %R is also in the oversold region, reinforcing the bullish sentiment.
Volatility Indicators:
- Bollinger Bands: The Bollinger Bands are widening, indicating increased volatility in the stock price. This could signify potential large price movements in the near future.
- Bollinger %B: The %B indicator is below 1, suggesting that the stock price is trading below the lower Bollinger Band, which might indicate an oversold condition.
Volume Indicators:
- On-Balance Volume (OBV): The OBV has been steadily increasing over the past 5 days, reflecting strong buying volume and accumulation of the stock.
- Chaikin Money Flow (CMF): The CMF is positive, indicating that money is flowing into the stock, supporting the bullish outlook.
Conclusion:
Based on the analysis of the trend, momentum, volatility, and volume indicators, the overall outlook for the stock is bullish. The positive trend in moving averages, bullish signals from MACD, increasing RSI, and strong buying pressure indicated by volume indicators all point towards a potential upward movement in the stock price. Additionally, the widening Bollinger Bands suggest the possibility of significant price fluctuations, which could present trading opportunities for investors.
In conclusion, considering the collective strength of the technical indicators and the prevailing market dynamics, it is likely that the stock will experience further upward movement in the coming days. Investors may consider buying or holding positions in anticipation of potential price appreciation.