Technical Analysis of TGRT 2024-05-10
Overview:
In analyzing the technical indicators for TGRT over the last 5 days, we will delve into the trend, momentum, volatility, and volume indicators to provide a comprehensive assessment of the stock's potential price movement. By examining these key factors, we aim to offer valuable insights and predictions for the upcoming days.
Trend Indicators:
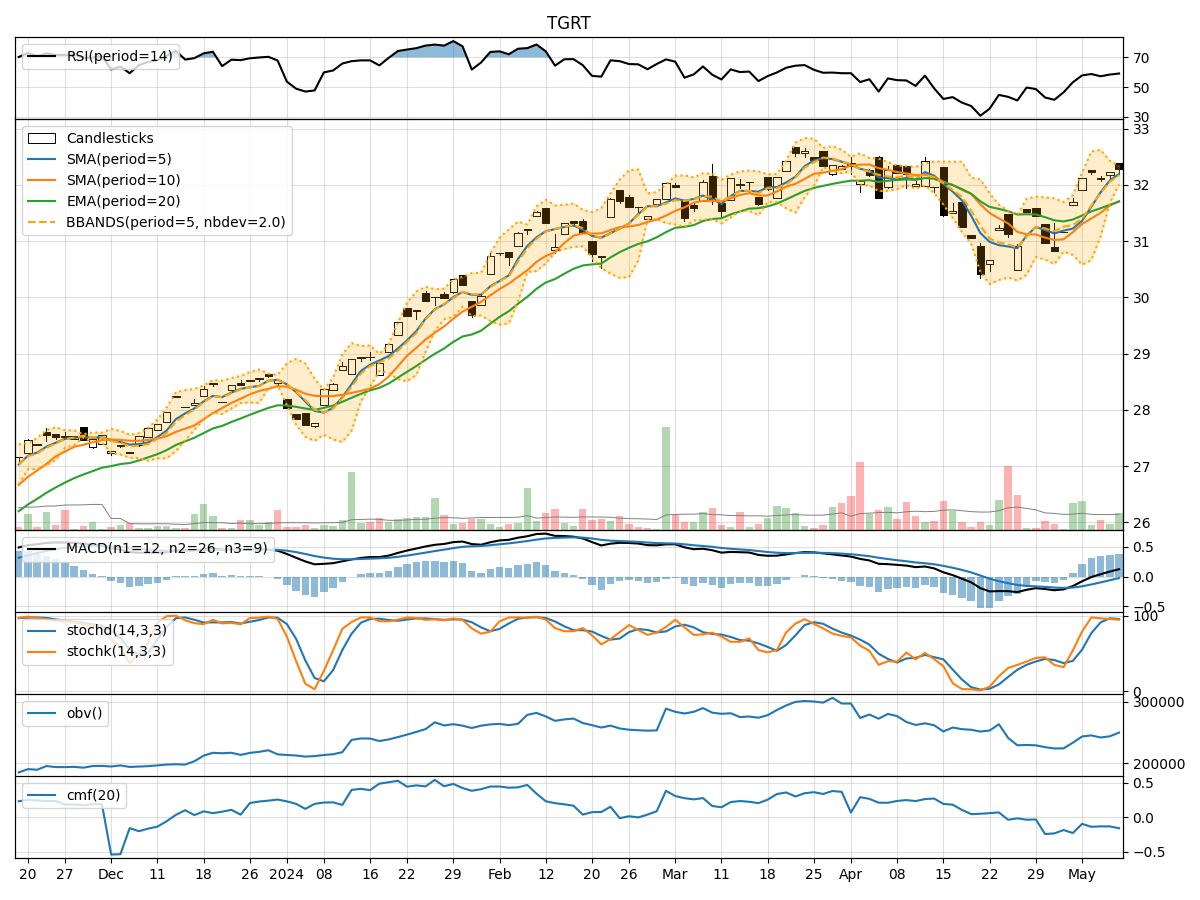
- Moving Averages (MA): The 5-day MA has been consistently above the closing price, indicating a short-term uptrend.
- MACD: The MACD line has been positive and increasing, suggesting bullish momentum.
- MACD Histogram: The histogram has been rising, indicating strengthening bullish momentum.
Key Observation: The trend indicators point towards a bullish sentiment in the short term.
Momentum Indicators:
- RSI: The RSI has been trending upwards, indicating increasing buying pressure.
- Stochastic Oscillator: Both %K and %D have been in overbought territory, suggesting a potential reversal.
- Williams %R: The indicator has been in oversold territory, signaling a potential buying opportunity.
Key Observation: Momentum indicators suggest a mixed sentiment with overbought conditions that may lead to a short-term correction.
Volatility Indicators:
- Bollinger Bands (BB): The stock price has been trading within the bands, indicating normal volatility.
- Bollinger %B: The %B has been fluctuating around 0.8, suggesting the stock is trading near the upper band.
Key Observation: Volatility indicators imply a stable price movement within the bands, with a slight tendency towards the upper band.
Volume Indicators:
- On-Balance Volume (OBV): The OBV has been fluctuating, indicating indecision among investors.
- Chaikin Money Flow (CMF): The CMF has been negative, suggesting selling pressure in the market.
Key Observation: Volume indicators reflect a lack of strong conviction among market participants, with a slight bias towards selling pressure.
Conclusion:
Based on the analysis of the technical indicators, the next few days' possible stock price movement for TGRT is likely to be sideways with a slight bearish bias. While trend indicators signal a bullish sentiment, momentum indicators indicate a potential short-term correction due to overbought conditions. Volatility indicators suggest stable price movement within the bands, and volume indicators reflect indecision and selling pressure.
Key Conclusion: Expect a consolidation phase with a potential downward bias in the near term. It is advisable to closely monitor the price action and key support levels for potential entry or exit points.