Technical Analysis of THLV 2024-05-10
Overview:
In analyzing the technical indicators for THLV over the last 5 days, we will delve into the trend, momentum, volatility, and volume indicators to provide a comprehensive outlook on the possible stock price movement in the coming days. By examining these key indicators, we aim to offer valuable insights and predictions for informed decision-making.
Trend Analysis:
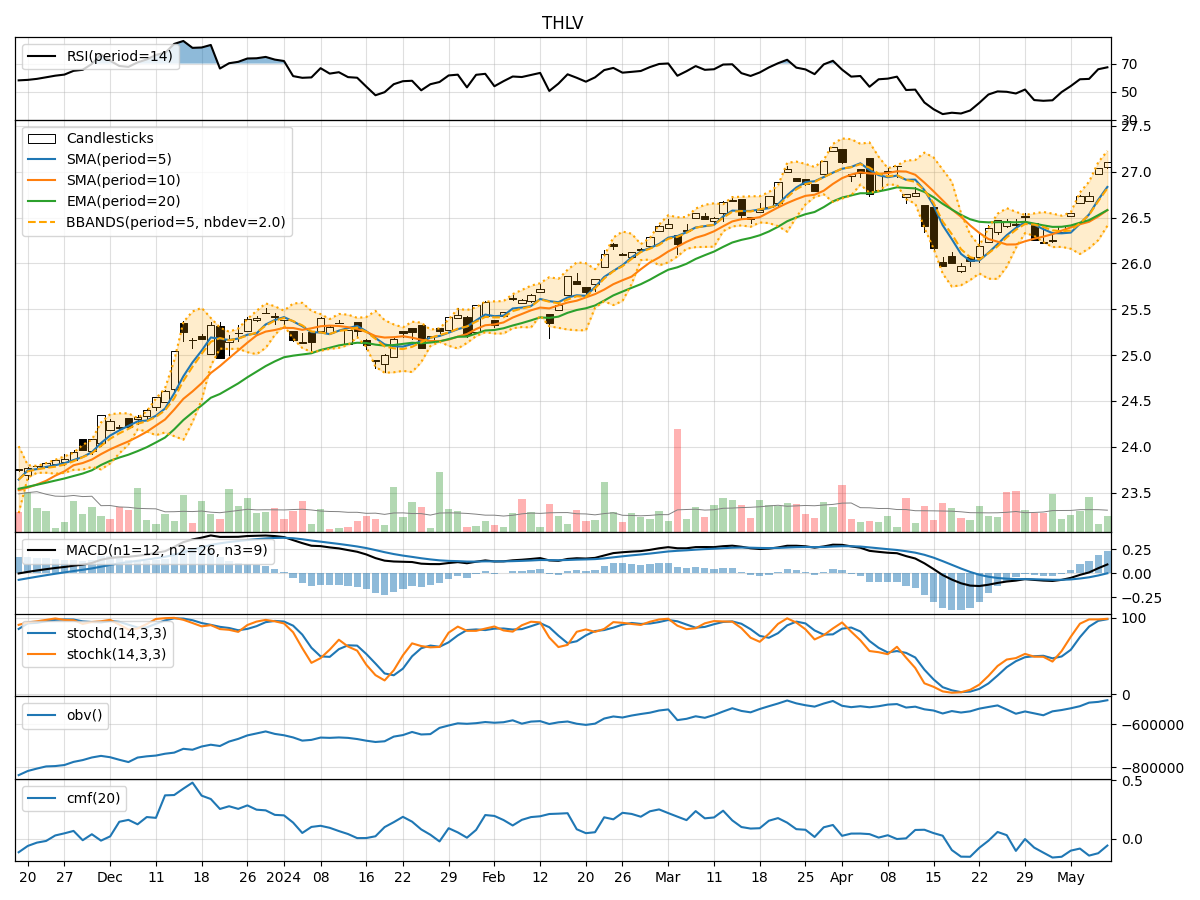
- Moving Averages (MA): The 5-day MA has been consistently above the 10-day SMA, indicating a short-term bullish trend. The EMA(20) has been steadily increasing, reflecting positive momentum.
- MACD: The MACD line has been above the signal line for the past few days, suggesting bullish momentum in the stock price.
- Conclusion: The trend indicators point towards an upward trend in the stock price.
Momentum Analysis:
- RSI: The RSI has been trending upwards and is currently in the overbought territory, indicating potential strength in the stock price.
- Stochastic Oscillator: Both %K and %D have been in the overbought zone, suggesting a strong bullish momentum.
- Conclusion: Momentum indicators signal a bullish sentiment in the stock.
Volatility Analysis:
- Bollinger Bands (BB): The stock price has been trading within the upper Bollinger Band, indicating increased volatility but also potential overbought conditions.
- Conclusion: Volatility indicators suggest a mixed outlook with potential for a pullback due to overbought conditions.
Volume Analysis:
- On-Balance Volume (OBV): The OBV has been showing a slight increase, indicating buying pressure in the stock.
- Chaikin Money Flow (CMF): The CMF has been negative, suggesting some distribution in the stock.
- Conclusion: Volume indicators present a neutral stance with a slight bias towards buying pressure.
Overall Conclusion:
Based on the analysis of trend, momentum, volatility, and volume indicators, the overall outlook for THLV in the next few days appears to be bullish. The stock is likely to continue its upward trend supported by positive momentum and buying pressure. However, caution is advised due to the potential overbought conditions indicated by volatility indicators. Traders may consider taking profits or implementing risk management strategies to navigate potential pullbacks.
Recommendation:
- Short-term Traders: Consider entering long positions with tight stop-loss orders to capitalize on the bullish momentum.
- Long-term Investors: Monitor the stock closely for potential profit-taking opportunities and consider scaling in or out of positions based on market conditions.
In conclusion, while the technical indicators suggest a bullish outlook for THLV, it is essential to remain vigilant and adapt to changing market dynamics to make informed trading decisions.