Technical Analysis of THNQ 2024-05-10
Overview:
In analyzing the technical indicators for THNQ over the last 5 days, we will delve into the trend, momentum, volatility, and volume indicators to provide a comprehensive outlook on the possible stock price movement. By examining these key aspects, we aim to offer valuable insights and predictions for the upcoming days.
Trend Analysis:
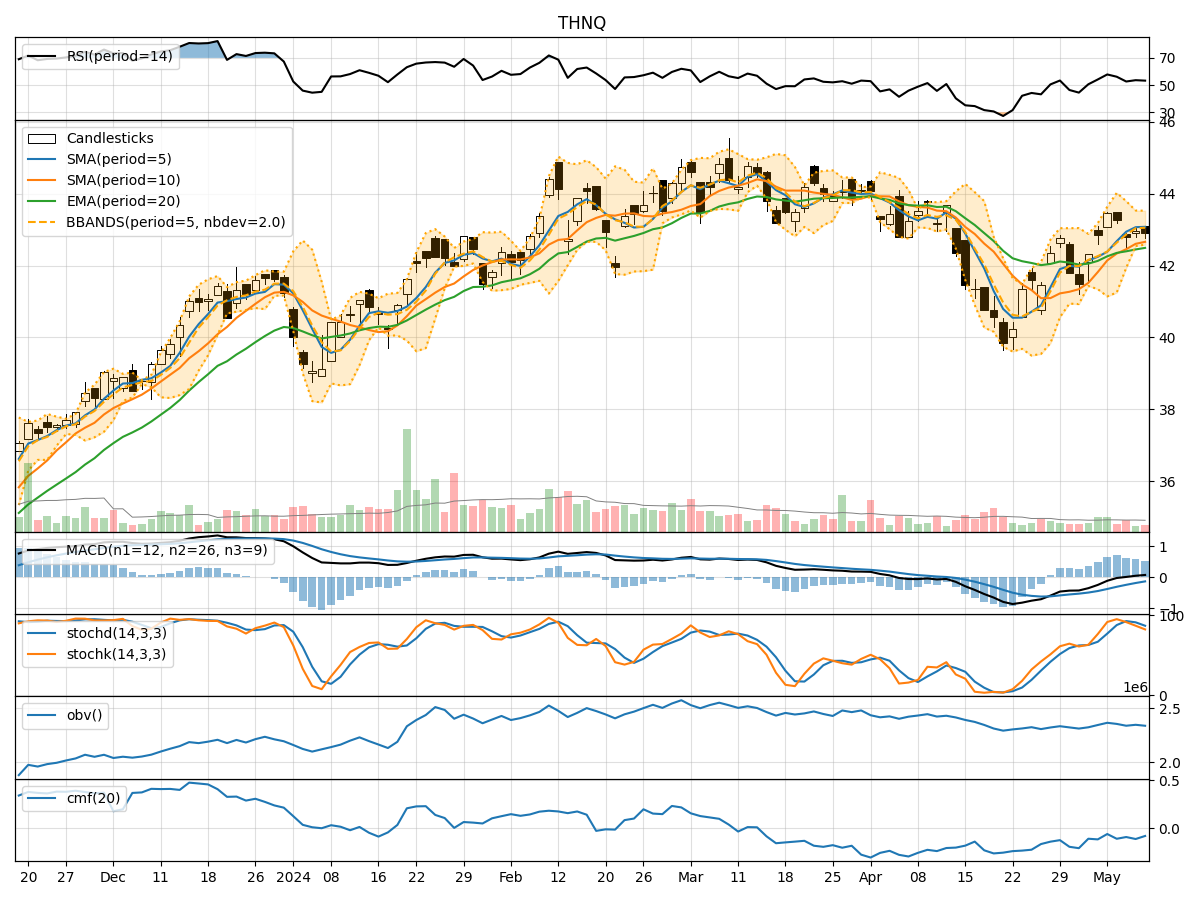
- Moving Averages (MA): The 5-day Moving Average (MA) has been consistently above the Simple Moving Average (SMA) and Exponential Moving Average (EMA), indicating a bullish trend.
- MACD: The MACD line has been consistently above the signal line, with both lines showing an upward trend, suggesting bullish momentum.
- Conclusion: The trend indicators point towards an upward trend in the stock price.
Momentum Analysis:
- RSI: The Relative Strength Index (RSI) has been fluctuating around the 50 level, indicating a neutral momentum.
- Stochastic Oscillator: Both %K and %D have been decreasing, moving towards the oversold territory, signaling a potential reversal.
- Williams %R: The Williams %R is in the oversold region, suggesting a possible buying opportunity.
- Conclusion: The momentum indicators suggest a potential reversal in the stock price.
Volatility Analysis:
- Bollinger Bands (BB): The stock price has been trading within the Bollinger Bands, with the bands narrowing, indicating decreasing volatility.
- Conclusion: Volatility is decreasing, which may lead to a period of consolidation or a breakout in the near future.
Volume Analysis:
- On-Balance Volume (OBV): The OBV has been declining, indicating selling pressure in the stock.
- Chaikin Money Flow (CMF): The CMF has been negative, suggesting a lack of buying interest.
- Conclusion: The volume indicators reflect a bearish sentiment in the stock.
Conclusion:
Based on the analysis of trend, momentum, volatility, and volume indicators, the next few days' possible stock price movement for THNQ is as follows: - The trend indicators suggest an upward trajectory. - Momentum indicators hint at a potential reversal in the stock price. - Volatility indicators point towards a period of consolidation or a breakout. - Volume indicators indicate a bearish sentiment.
Overall View:
Considering the mixed signals from the different indicators, it is crucial to monitor the stock closely. Investors should exercise caution and wait for confirmation of a clear trend before making any significant trading decisions. The stock may experience some volatility in the short term, but the overall trend appears to be bullish.