Technical Analysis of THY 2024-05-10
Overview:
In analyzing the technical indicators for THY stock over the last 5 days, we will delve into the trend, momentum, volatility, and volume indicators to provide a comprehensive outlook on the possible future stock price movement. By examining these key indicators, we aim to offer valuable insights and predictions for the upcoming trading days.
Trend Analysis:
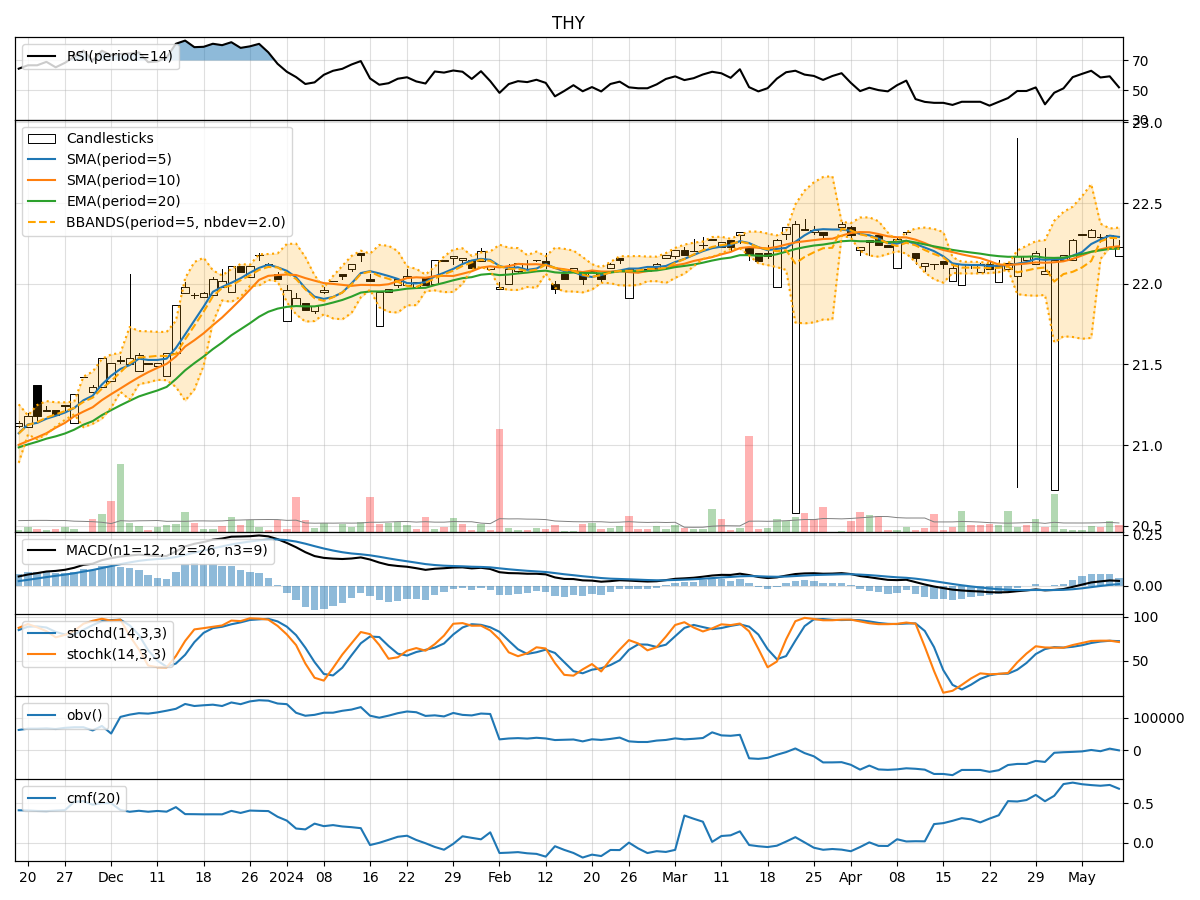
- Moving Averages (MA): The 5-day Moving Average (MA) has been consistently above the Simple Moving Average (SMA) and Exponential Moving Average (EMA), indicating a short-term bullish trend.
- MACD: The MACD line has been above the signal line, with both lines showing an upward trend, suggesting bullish momentum.
- MACD Histogram: The MACD Histogram has been consistently positive, indicating increasing bullish momentum.
Momentum Analysis:
- RSI: The Relative Strength Index (RSI) has been fluctuating around the 50 level, indicating a neutral momentum in the stock.
- Stochastic Oscillator: Both %K and %D lines of the Stochastic Oscillator have been hovering around the overbought zone, suggesting a potential reversal or consolidation.
- Williams %R: The Williams %R indicator has been in the oversold territory, indicating a potential buying opportunity.
Volatility Analysis:
- Bollinger Bands: The stock price has been trading within the Bollinger Bands, with the bands narrowing, suggesting a period of low volatility.
- Bollinger %B: The %B indicator has been decreasing, indicating a potential consolidation phase.
Volume Analysis:
- On-Balance Volume (OBV): The OBV has been fluctuating, indicating indecision among investors regarding the stock.
- Chaikin Money Flow (CMF): The CMF has been positive, suggesting buying pressure in the stock.
Conclusion:
Based on the analysis of the technical indicators, the stock is currently in a consolidation phase with neutral momentum. The trend indicators suggest a short-term bullish bias, supported by the moving averages and MACD. However, the momentum indicators, particularly the Stochastic Oscillator and Williams %R, indicate a potential reversal or consolidation in the near term.
Considering the low volatility and indecisive volume, it is likely that the stock will continue to trade within a narrow range in the coming days. Traders should exercise caution and wait for clearer signals before taking any significant positions. Overall, the outlook for the next few days is sideways with a slight bullish bias.