Technical Analysis of THYF 2024-05-10
Overview:
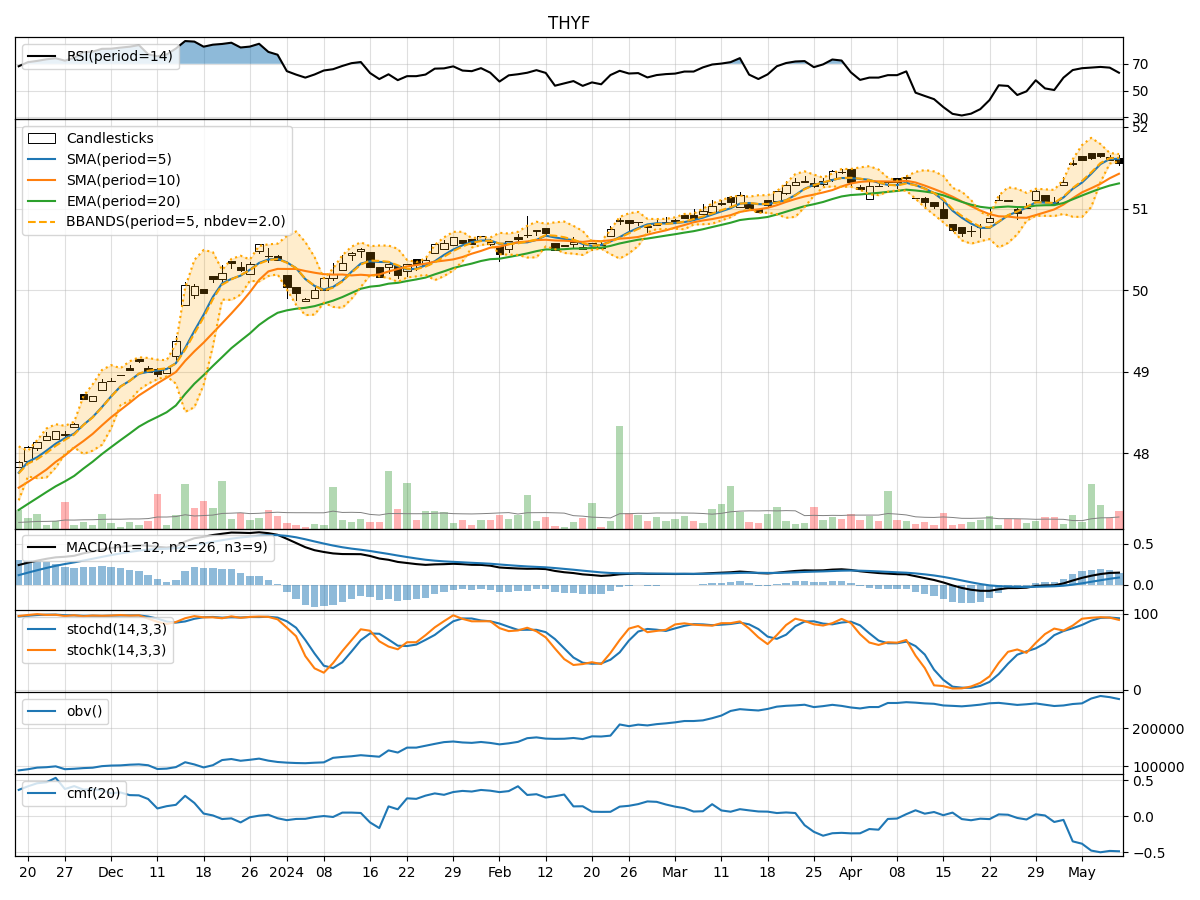
In the last 5 trading days, THYF stock has shown a consistent uptrend in its price, supported by positive momentum and relatively stable volatility. The volume has also been increasing, indicating growing interest from market participants.
Trend Indicators Analysis:
- Moving Averages (MA): The 5-day Moving Average (MA) has been consistently above the Simple Moving Average (SMA) and Exponential Moving Average (EMA), indicating a bullish trend.
- MACD: The MACD line has been above the signal line, with both lines showing an upward trend, suggesting continued bullish momentum.
- MACD Histogram: The MACD Histogram has been increasing, indicating strengthening bullish momentum.
Key Observation: The trend indicators suggest a strong bullish sentiment in the stock price.
Momentum Indicators Analysis:
- RSI: The Relative Strength Index (RSI) has been in the overbought territory but has not shown any signs of divergence, indicating sustained buying pressure.
- Stochastic Oscillator: Both %K and %D lines of the Stochastic Oscillator have been in the overbought zone, suggesting a strong upward momentum.
- Williams %R: The Williams %R has been consistently in the oversold region, indicating a strong bullish momentum.
Key Observation: Momentum indicators confirm the bullish sentiment and suggest that the stock may continue its upward movement.
Volatility Indicators Analysis:
- Bollinger Bands: The stock price has been trading within the Bollinger Bands, with the bands narrowing slightly, indicating a potential decrease in volatility.
- Bollinger %B: The %B indicator has been hovering around 0.7, suggesting the stock is trading closer to the upper band.
Key Observation: Volatility indicators point towards a potential decrease in volatility and a possible continuation of the current trend.
Volume Indicators Analysis:
- On-Balance Volume (OBV): The OBV has been steadily increasing, indicating accumulation by investors.
- Chaikin Money Flow (CMF): The CMF has been negative but improving, suggesting a potential shift towards buying pressure.
Key Observation: Increasing volume and improving CMF indicate growing interest from investors, supporting the bullish trend.
Conclusion:
Based on the analysis of trend, momentum, volatility, and volume indicators, the stock is likely to continue its upward movement in the next few days. The strong bullish sentiment supported by positive momentum, decreasing volatility, and increasing volume suggests that buyers are in control of the market. Therefore, it is recommended to consider buying or holding positions in THYF stock for potential further gains.
Key Conclusion: Bullish sentiment is prevailing, and the stock is expected to continue its upward trajectory.