Technical Analysis of TILL 2024-05-10
Overview:
In analyzing the technical indicators for TILL stock over the last 5 days, we will delve into the trend, momentum, volatility, and volume indicators to provide a comprehensive outlook on the possible future stock price movement. By examining these key indicators, we aim to offer valuable insights and recommendations for potential investors.
Trend Analysis:
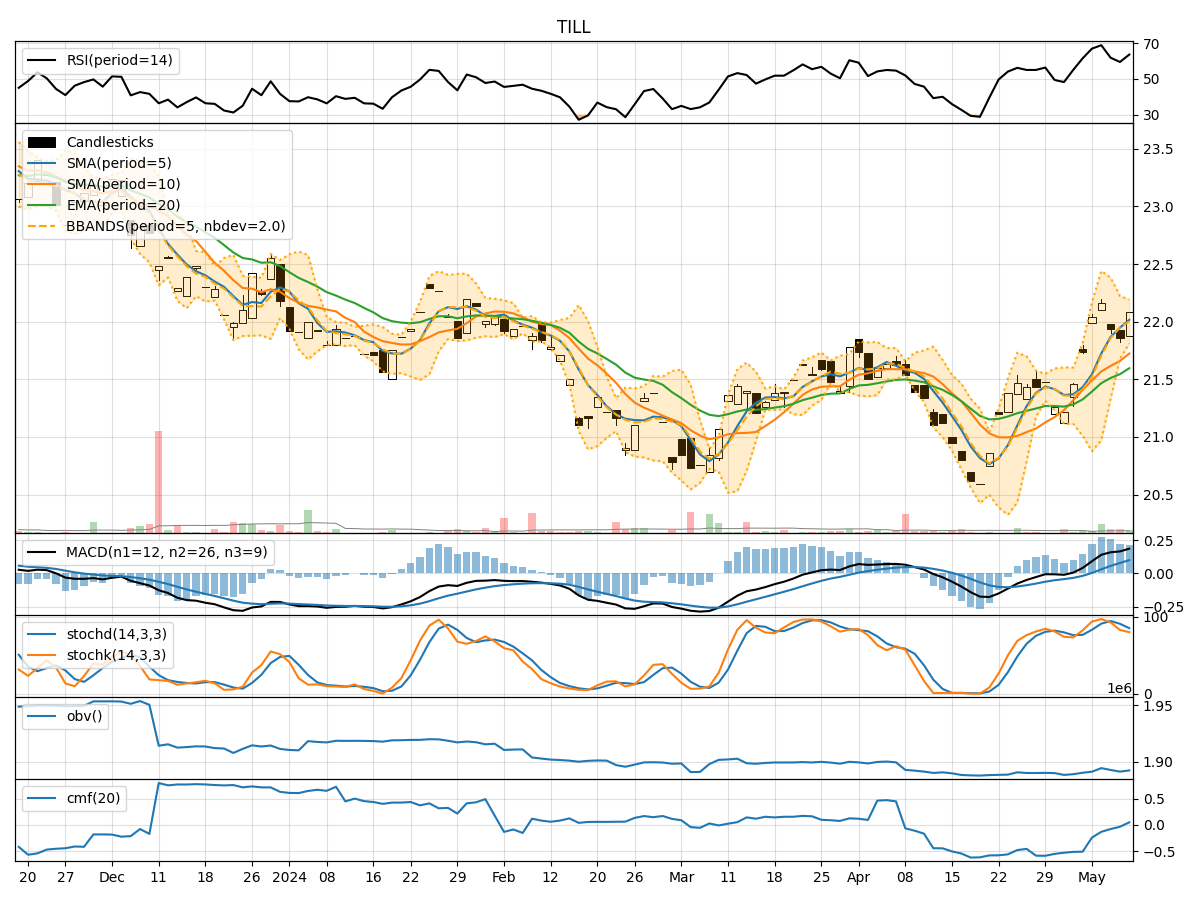
- Moving Averages (MA): The 5-day Moving Average (MA) has been consistently above the Simple Moving Average (SMA) and Exponential Moving Average (EMA), indicating a bullish trend.
- MACD: The MACD line has been consistently above the signal line, with both lines showing an upward trend, suggesting bullish momentum.
Momentum Analysis:
- RSI: The Relative Strength Index (RSI) has been fluctuating around the 60-70 range, indicating a neutral momentum.
- Stochastic Oscillator: Both %K and %D have been fluctuating, showing mixed signals in momentum.
Volatility Analysis:
- Bollinger Bands (BB): The stock price has been trading within the Bollinger Bands, with the bands narrowing, suggesting decreasing volatility.
Volume Analysis:
- On-Balance Volume (OBV): The OBV has been negative, indicating selling pressure in the stock.
- Chaikin Money Flow (CMF): The CMF has been negative, suggesting a lack of buying pressure.
Key Observations:
- The trend indicators suggest a bullish sentiment in the short term.
- Momentum indicators show mixed signals, indicating potential indecision among traders.
- Volatility has been decreasing, which could lead to a period of consolidation.
- Volume indicators point towards selling pressure in the stock.
Conclusion:
Based on the analysis of the technical indicators, the next few days for TILL stock could see sideways movement or consolidation. While the trend indicators are bullish, the mixed signals in momentum and selling pressure indicated by volume indicators suggest a lack of strong conviction in either direction. The decreasing volatility also supports the view of a potential period of consolidation. Investors should closely monitor the price action and wait for clearer signals before making significant trading decisions.