Technical Analysis of TILT 2024-05-10
Overview:
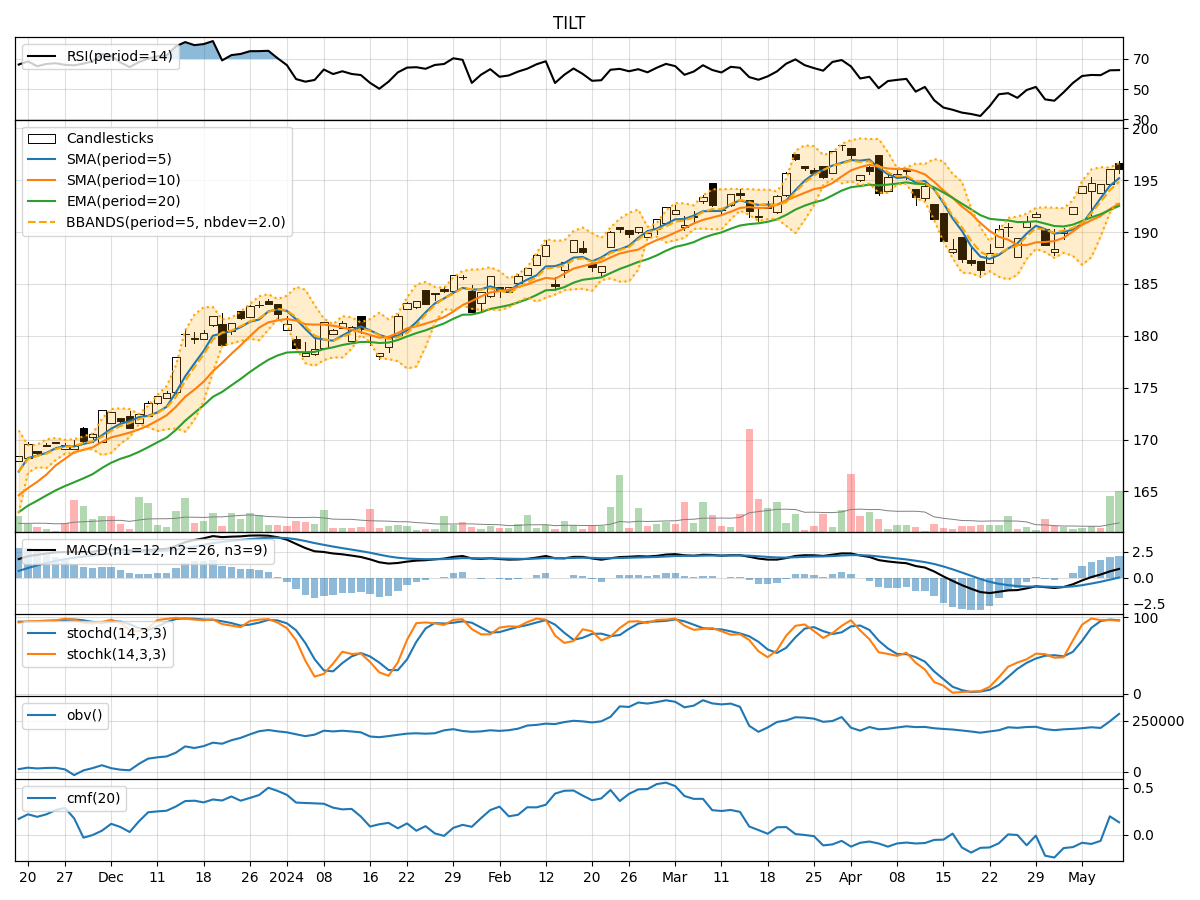
In analyzing the technical indicators for TILT stock over the last 5 days, we will delve into the trends, momentum, volatility, and volume aspects to provide a comprehensive outlook on the possible stock price movement in the coming days. By examining key indicators such as moving averages, MACD, RSI, Bollinger Bands, and OBV, we aim to offer valuable insights and predictions for informed decision-making.
Trend Analysis:
- Moving Averages (MA): The 5-day MA has been consistently above the 10-day SMA, indicating a short-term bullish trend.
- MACD: The MACD line has been above the signal line for the past few days, suggesting a bullish momentum.
- EMA: The EMA(20) has been trending upwards, reflecting a positive price trend.
Momentum Analysis:
- RSI: The RSI has been gradually increasing and is currently in the overbought territory, signaling potential strength in the uptrend.
- Stochastic Oscillator: Both %K and %D have been relatively high, indicating strong buying momentum.
- Williams %R: The indicator has been fluctuating around oversold levels, suggesting potential buying opportunities.
Volatility Analysis:
- Bollinger Bands: The stock price has been trading within the bands, with the upper band acting as a resistance level and the lower band as a support level.
- Bollinger %B: The %B indicator has been hovering around 0.8, indicating a relatively high price compared to the upper band.
- Bollinger Bandwidth: The bandwidth has been narrowing, suggesting a potential decrease in volatility.
Volume Analysis:
- On-Balance Volume (OBV): The OBV has been increasing steadily, indicating strong buying pressure.
- Chaikin Money Flow (CMF): The CMF has been positive, reflecting accumulation in the stock.
Key Observations:
- The technical indicators collectively suggest a bullish outlook for TILT stock in the near term.
- The uptrend is supported by positive momentum, increasing buying pressure, and narrowing volatility.
- The stock is likely to continue its upward trajectory based on the current technical signals.
Conclusion:
Based on the analysis of the trend, momentum, volatility, and volume indicators, the next few days for TILT stock are likely to see further upward movement. Traders and investors may consider buying opportunities in line with the bullish trend. It is essential to monitor key resistance levels indicated by the Bollinger Bands and adjust risk management strategies accordingly. Overall, the technical analysis points towards a favorable outlook for TILT stock in the upcoming trading sessions.