Technical Analysis of TINT 2024-05-10
Overview:
In analyzing the technical indicators for TINT over the last 5 days, we will delve into the trend, momentum, volatility, and volume indicators to provide a comprehensive outlook on the possible stock price movement in the coming days. By examining these key aspects, we aim to offer valuable insights and recommendations for potential investors.
Trend Analysis:
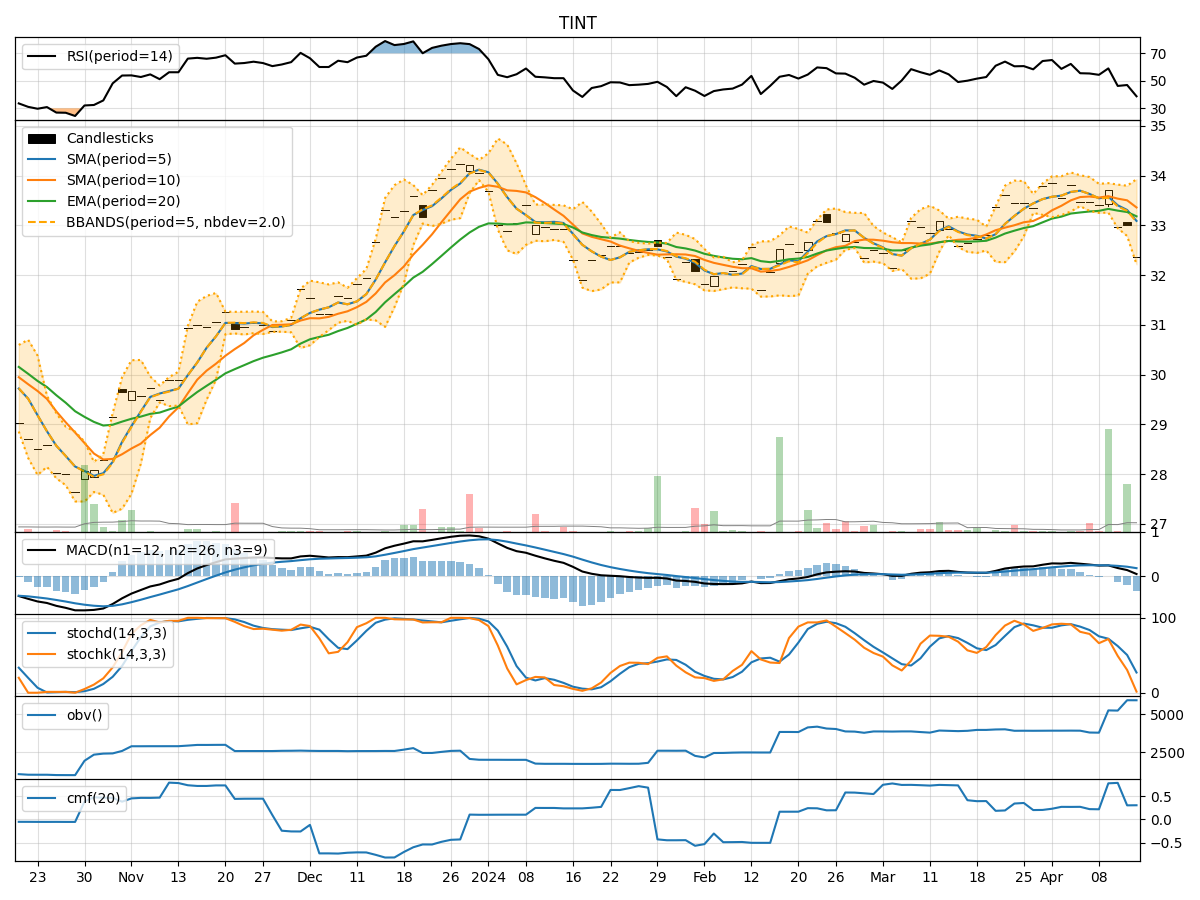
- Moving Averages (MA): The 5-day Moving Average (MA) has been consistently trending upwards, indicating a positive momentum in the stock price.
- MACD: The Moving Average Convergence Divergence (MACD) has shown a gradual increase over the past 5 days, suggesting a strengthening bullish trend.
- EMA: The Exponential Moving Average (EMA) has also been on an upward trajectory, supporting the bullish sentiment in the short term.
Momentum Analysis:
- RSI: The Relative Strength Index (RSI) has been hovering in the overbought territory, indicating a strong buying momentum in the stock.
- Stochastic Oscillator: Both %K and %D values of the Stochastic Oscillator are relatively high, signaling a bullish momentum.
- Williams %R: The Williams %R indicator is in the oversold region, suggesting a potential reversal in the stock price.
Volatility Analysis:
- Bollinger Bands (BB): The Bollinger Bands have been narrowing, indicating decreasing volatility in the stock price.
- BB %B: The %B value is relatively low, suggesting a potential consolidation phase in the near future.
Volume Analysis:
- On-Balance Volume (OBV): The OBV indicator has shown mixed signals over the past 5 days, reflecting indecision among market participants.
- Chaikin Money Flow (CMF): The CMF has been negative, indicating a net outflow of money from the stock.
Key Observations:
- The trend indicators suggest a bullish sentiment in the short term, supported by the positive movement in moving averages and MACD.
- Momentum indicators point towards a strong buying momentum, with RSI in the overbought region and Stochastic Oscillator showing bullish signals.
- Volatility indicators indicate a potential decrease in volatility, possibly leading to a period of consolidation.
- Volume indicators reflect mixed signals, with OBV showing indecision and CMF indicating a net outflow of money from the stock.
Conclusion:
Based on the analysis of the technical indicators, the next few days' possible stock price movement for TINT is likely to continue in an upward direction. The bullish trend supported by moving averages, MACD, and momentum indicators suggests a positive outlook for the stock. However, the decreasing volatility and mixed volume signals may lead to a period of consolidation before further upward movement. Investors should consider entering long positions with caution and closely monitor key support and resistance levels for potential profit-taking opportunities.