Technical Analysis of TINY 2024-05-10
Overview:
In analyzing the technical indicators for TINY stock over the last 5 days, we will delve into the trend, momentum, volatility, and volume indicators to provide a comprehensive outlook on the possible stock price movement in the coming days. By examining these key indicators, we aim to offer valuable insights and predictions for informed decision-making.
Trend Analysis:
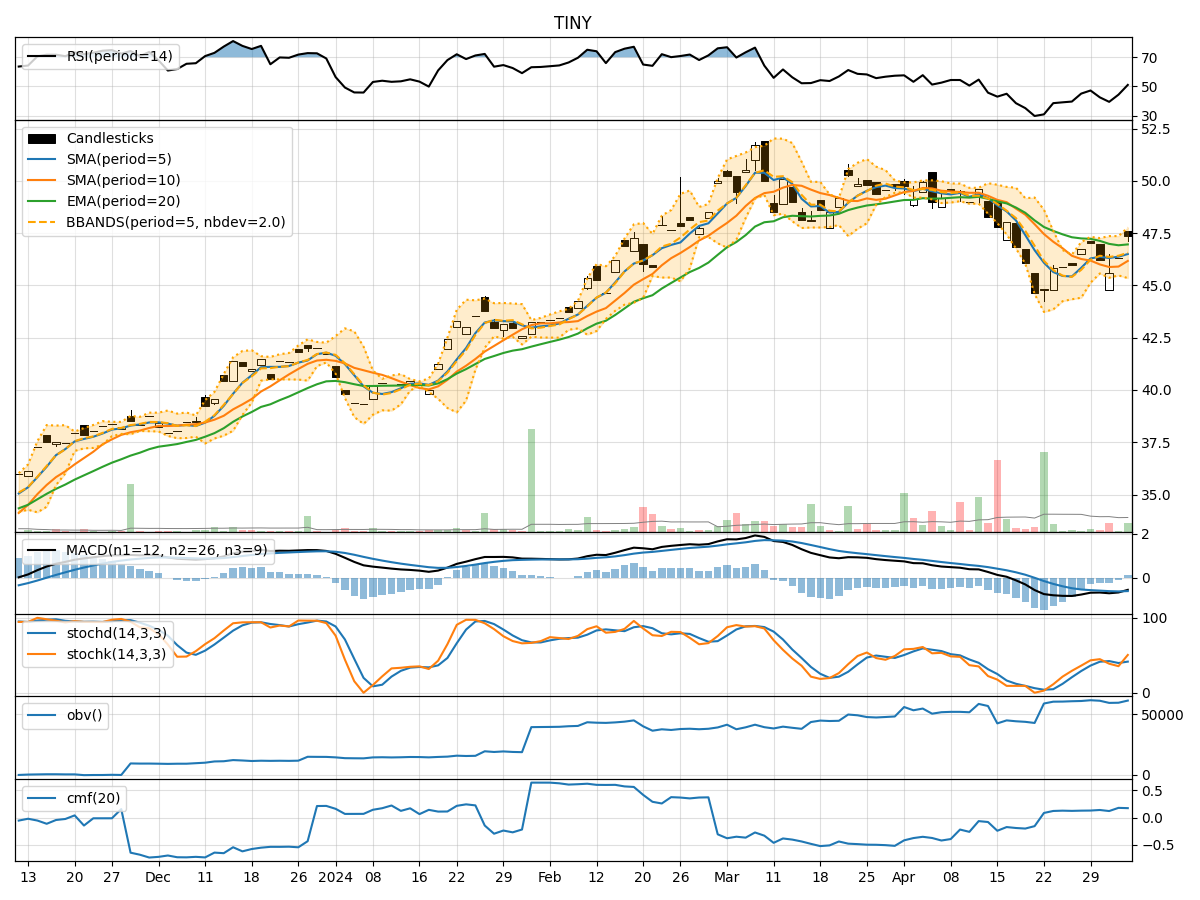
- Moving Averages (MA): The 5-day Moving Average (MA) has been consistently rising, indicating a bullish trend in the short term.
- MACD: The MACD line has been above the signal line for the past few days, suggesting a bullish momentum.
- EMA: The Exponential Moving Average (EMA) has also been trending upwards, supporting the bullish sentiment.
Momentum Analysis:
- RSI: The Relative Strength Index (RSI) has been increasing, showing strengthening momentum.
- Stochastic Oscillator: Both %K and %D lines of the Stochastic Oscillator have been in the overbought zone, indicating a strong bullish momentum.
- Williams %R: The Williams %R is in the oversold region, suggesting a potential reversal in the short term.
Volatility Analysis:
- Bollinger Bands: The stock price has been trading within the Bollinger Bands, with the bands narrowing, indicating decreasing volatility.
- Bollinger %B: The %B indicator is above 0.5, suggesting a bullish trend.
- Average True Range (ATR): The ATR value has been decreasing, indicating lower volatility in the stock.
Volume Analysis:
- On-Balance Volume (OBV): The OBV has been relatively stable, indicating consistent buying interest in the stock.
- Chaikin Money Flow (CMF): The CMF has been positive, suggesting money flow into the stock over the past 20 days.
Key Observations:
- The trend indicators point towards a bullish sentiment, supported by the moving averages and MACD.
- Momentum indicators indicate a strong bullish momentum, with the RSI and Stochastic Oscillator in overbought territory.
- Volatility has been decreasing, suggesting a potential period of consolidation or a minor pullback.
- Volume indicators show consistent buying interest in the stock, supporting the bullish outlook.
Conclusion:
Based on the analysis of the technical indicators, the next few days for TINY stock are likely to see continued upward movement. The bullish trend, strong momentum, decreasing volatility, and consistent buying interest all point towards a positive outlook for the stock price. Traders and investors may consider buying opportunities in TINY stock for potential short to medium-term gains.