Technical Analysis of TJUL 2024-05-10
Overview:
In analyzing the technical indicators for TJUL stock over the last 5 days, we will delve into the trend, momentum, volatility, and volume indicators to provide a comprehensive outlook on the possible stock price movement in the coming days. By examining these key indicators, we aim to offer valuable insights and predictions for potential investors.
Trend Analysis:
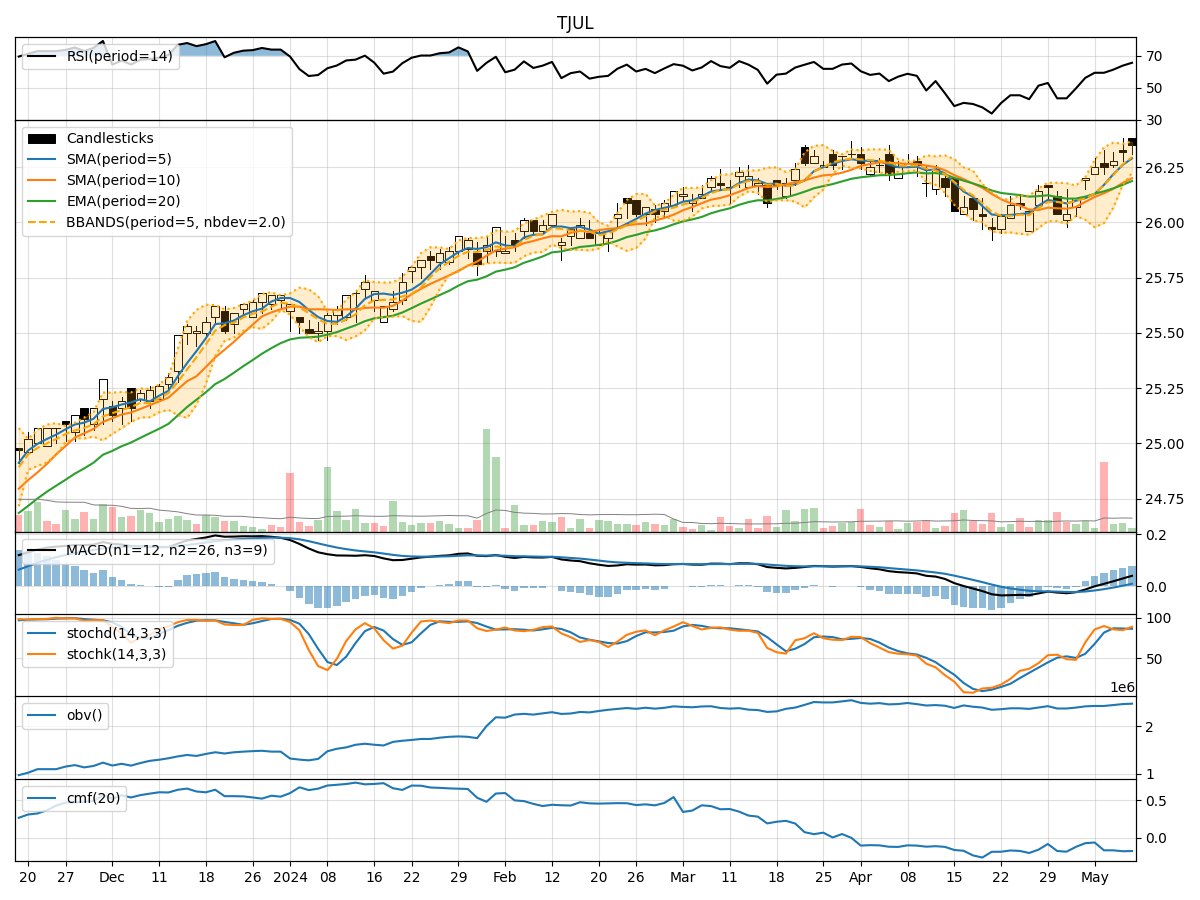
- Moving Averages (MA): The moving averages show a consistent uptrend with the closing price above the short-term moving averages (MA(5), SMA(10)) and the exponential moving average (EMA(20)). This indicates a positive trend in the stock price.
- MACD: The MACD line is above the signal line, suggesting bullish momentum in the stock.
Momentum Analysis:
- RSI: The Relative Strength Index (RSI) is in the neutral zone, indicating potential for both upward and downward movements.
- Stochastic Oscillator: Both %K and %D are in the overbought region, signaling a potential reversal or consolidation.
Volatility Analysis:
- Bollinger Bands (BB): The stock price is currently trading near the upper Bollinger Band, indicating a period of high volatility and a possible overbought condition.
Volume Analysis:
- On-Balance Volume (OBV): The OBV indicator has been increasing, suggesting accumulation by investors.
- Chaikin Money Flow (CMF): The CMF is negative, indicating selling pressure in the stock.
Key Observations:
- The trend indicators suggest a bullish sentiment with the moving averages and MACD supporting an upward trend.
- Momentum indicators show a mixed signal with RSI neutral and stochastic oscillator in the overbought region.
- Volatility is high as indicated by the Bollinger Bands, potentially signaling a period of increased price fluctuations.
- Volume indicators reflect a divergence with OBV showing accumulation while CMF indicates selling pressure.
Conclusion:
Based on the analysis of the technical indicators, the next few days for TJUL stock could see further upward movement in the stock price. The bullish trend supported by moving averages and MACD, coupled with high volatility, may lead to potential price spikes. However, caution is advised due to the mixed signals from momentum indicators and the possibility of a reversal from the overbought levels. Investors should closely monitor the price action and consider setting appropriate stop-loss levels to manage risk effectively.