Technical Analysis of TLTD 2024-05-10
Overview:
In analyzing the technical indicators for TLTD over the last 5 days, we will delve into the trend, momentum, volatility, and volume indicators to provide a comprehensive outlook on the possible stock price movement in the coming days. By examining these key aspects, we aim to offer valuable insights and predictions for informed decision-making.
Trend Analysis:
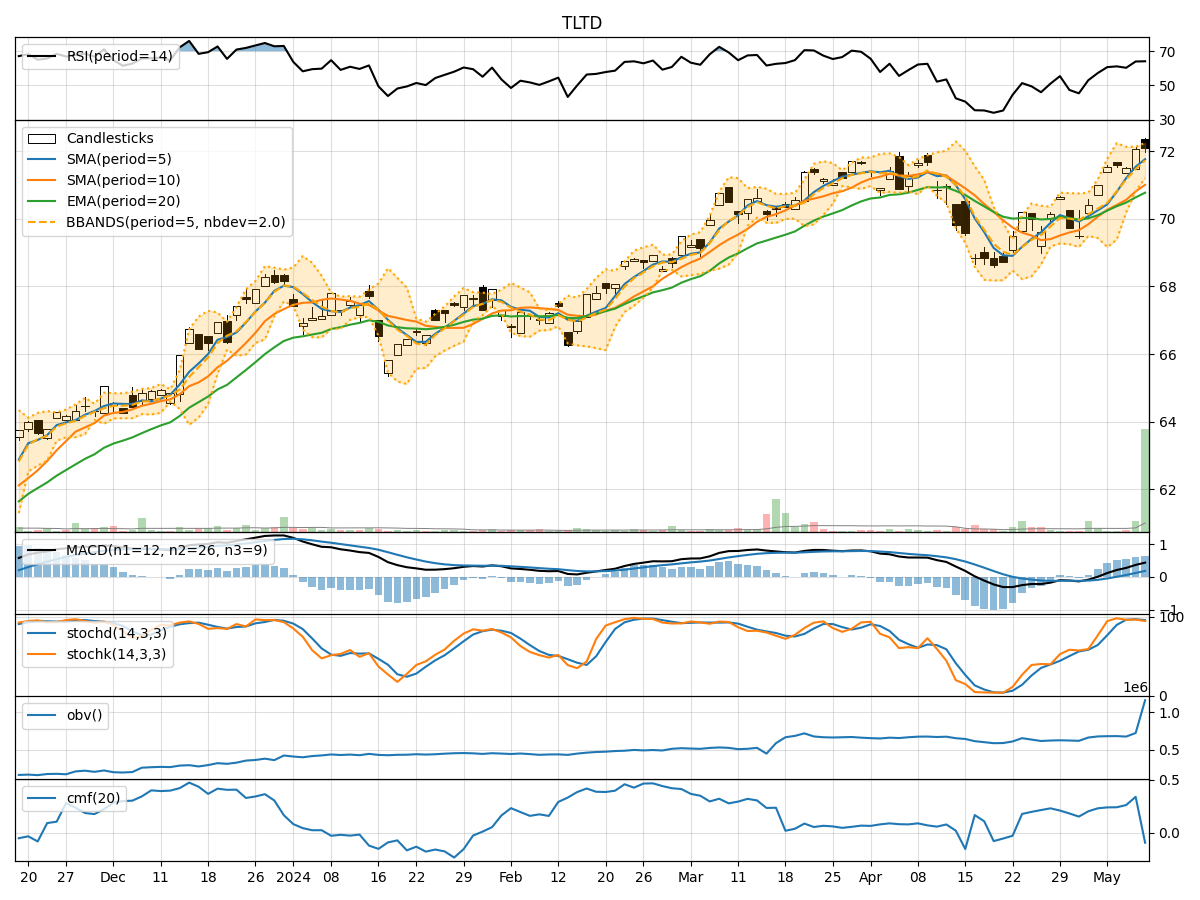
- Moving Averages (MA): The 5-day Moving Average (MA) has been consistently above the Simple Moving Average (SMA) and Exponential Moving Average (EMA), indicating a bullish trend.
- MACD: The MACD line has been consistently above the signal line, suggesting positive momentum in the stock price.
- Conclusion: The trend indicators point towards an upward trend in the stock price.
Momentum Analysis:
- RSI: The Relative Strength Index (RSI) has been above 50, indicating bullish momentum.
- Stochastic Oscillator: Both %K and %D have been in the overbought zone, signaling a strong bullish momentum.
- Conclusion: Momentum indicators suggest a bullish sentiment in the stock.
Volatility Analysis:
- Bollinger Bands (BB): The stock price has been trading within the upper Bollinger Band (BBU), indicating high volatility.
- Conclusion: Volatility indicators suggest high volatility in the stock price.
Volume Analysis:
- On-Balance Volume (OBV): The OBV has been increasing, indicating accumulation by investors.
- Chaikin Money Flow (CMF): The CMF has been positive, suggesting buying pressure.
- Conclusion: Volume indicators point towards positive accumulation and buying pressure.
Key Observations:
- The trend and momentum indicators both suggest a bullish outlook for the stock price.
- Volatility remains high, indicating potential price swings.
- Volume indicators show positive accumulation and buying pressure.
Conclusion:
Based on the analysis of the technical indicators, the next few days are likely to see the TLTD stock price continue its upward trajectory. Investors may consider buying opportunities in line with the bullish trend and positive momentum. However, it is essential to monitor volatility and set appropriate risk management strategies to navigate potential price fluctuations.
Disclaimer:
This analysis is based solely on technical indicators and historical data. It is important to consider other factors such as market news, economic conditions, and company performance before making investment decisions. Always conduct thorough research and consult with a financial advisor for personalized guidance tailored to your investment goals and risk tolerance.