Technical Analysis of TMAT 2024-05-10
Overview:
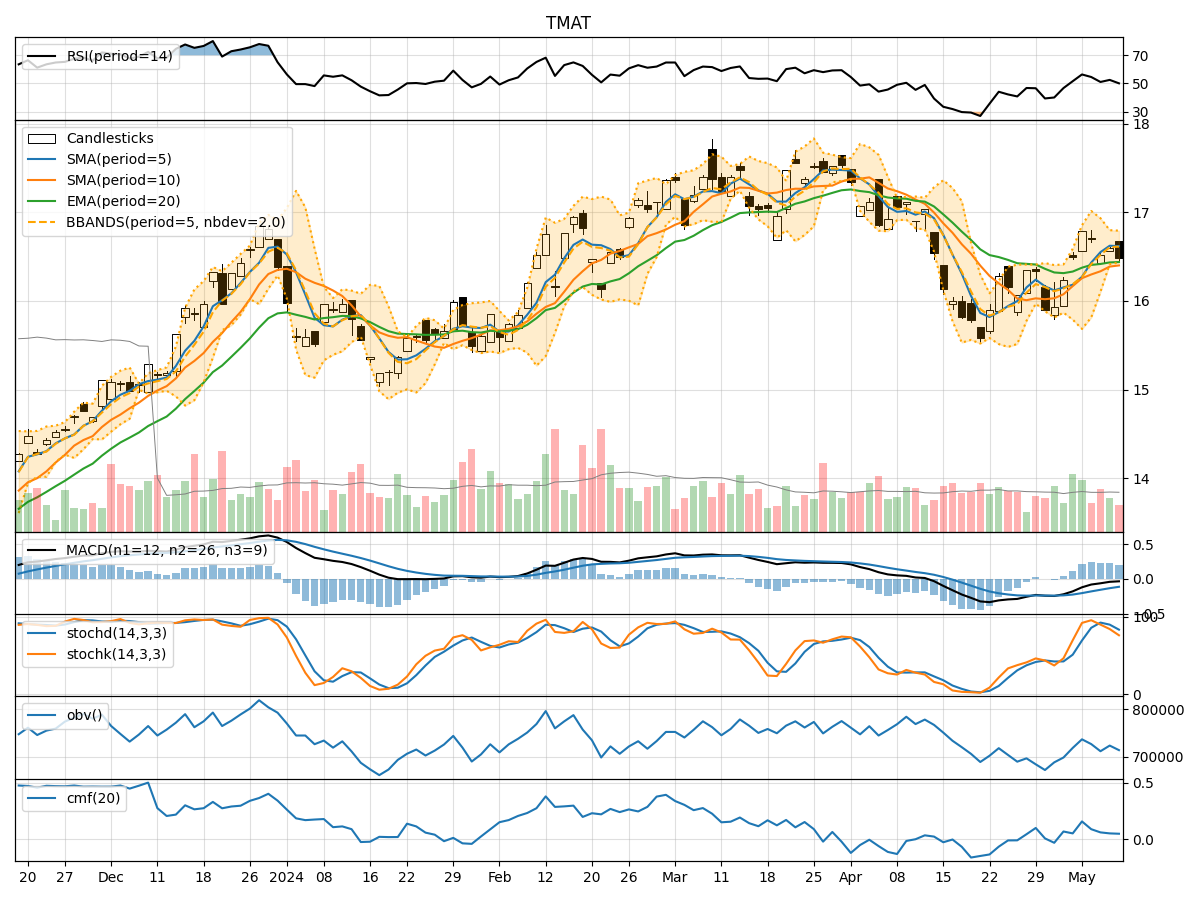
In analyzing the provided TMAT TA data for the last 5 days, we will delve into the technical indicators across trend, momentum, volatility, and volume to derive insights into the possible future stock price movement. By examining key metrics and patterns, we aim to provide a comprehensive and informed prediction for the upcoming days.
Trend Analysis:
- Moving Averages (MA): The 5-day Moving Average (MA) has been consistently above the closing prices, indicating a short-term uptrend.
- MACD: The Moving Average Convergence Divergence (MACD) has shown positive values, suggesting bullish momentum.
- RSI: The Relative Strength Index (RSI) has been fluctuating around the neutral zone, indicating a balanced market sentiment.
Momentum Analysis:
- Stochastic Oscillator: The Stochastic Oscillator reflects a downward trend, with both %K and %D values decreasing over the last few days.
- Williams %R: The Williams %R indicator is in the oversold territory, signaling a potential reversal or consolidation.
Volatility Analysis:
- Bollinger Bands (BB): The Bollinger Bands have narrowed, indicating decreasing volatility and a possible period of consolidation.
- Average True Range (ATR): The ATR values have been relatively stable, suggesting a lack of significant price fluctuations.
Volume Analysis:
- On-Balance Volume (OBV): The OBV has shown mixed movements, with some days experiencing selling pressure and others showing accumulation.
- Chaikin Money Flow (CMF): The CMF has been positive but declining, indicating weakening buying pressure.
Key Observations:
- The trend indicators suggest a short-term uptrend, supported by positive MACD values.
- Momentum indicators point towards a potential reversal or consolidation phase, as reflected by the Stochastic Oscillator and Williams %R.
- Volatility indicators indicate a period of reduced price fluctuations and possible consolidation.
- Volume indicators show mixed signals, with OBV reflecting alternating buying and selling pressure.
Conclusion:
Based on the analysis of the technical indicators, the next few days' possible stock price movement is likely to be sideways or consolidation. The market is showing signs of indecision, with conflicting signals from momentum and volume indicators. Traders should exercise caution and wait for clearer signals before making significant trading decisions.