Technical Analysis of TMFE 2024-05-10
Overview:
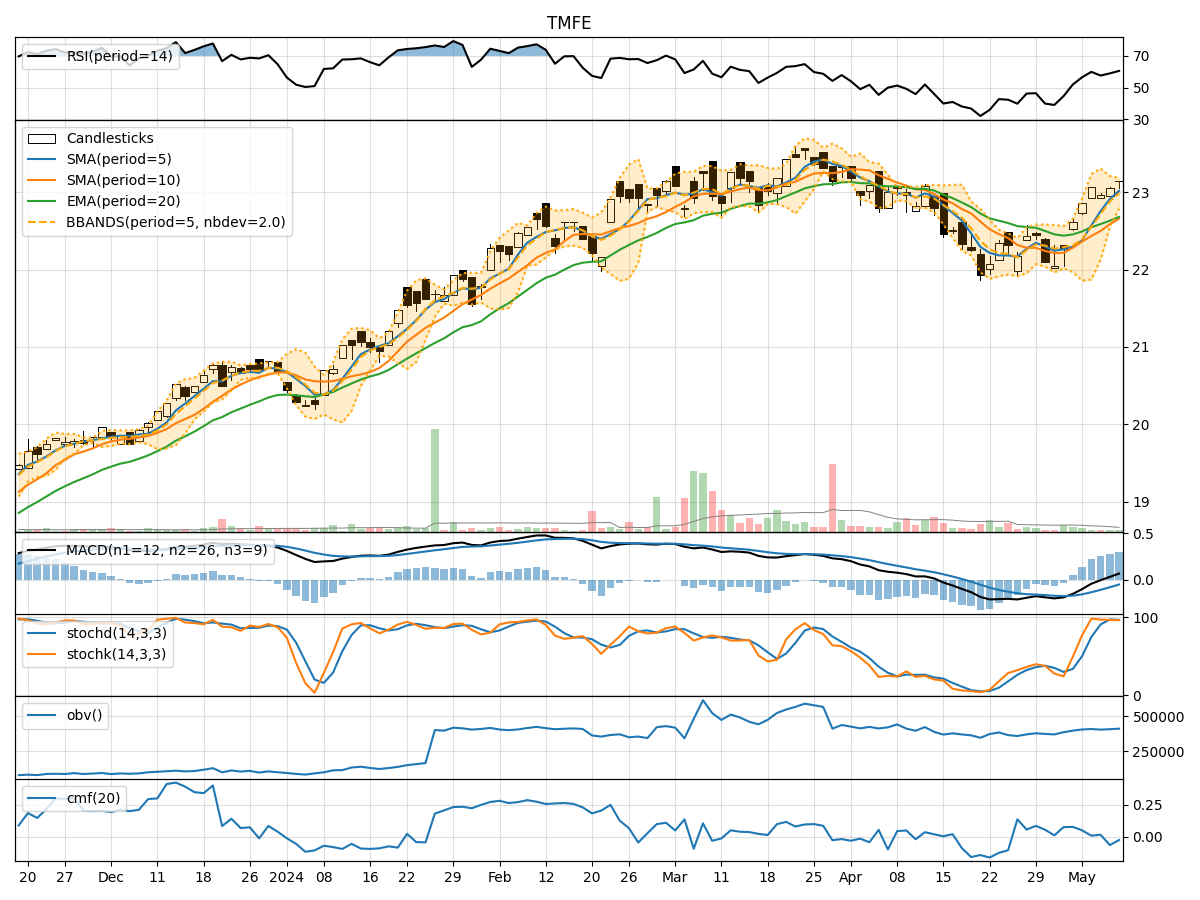
In the last 5 trading days, TMFE stock has shown mixed signals across various technical indicators. The trend indicators suggest a slightly bullish sentiment, with the moving averages trending upwards. Momentum indicators indicate a neutral to slightly bullish momentum, while volatility indicators show a decreasing trend in volatility. Volume indicators are mixed, with some days showing positive volume flow and others negative.
Trend Indicators:
- Moving Averages (MA): The 5-day moving average has been trending above the 10-day simple moving average, indicating a short-term bullish trend.
- MACD: The MACD line has been consistently above the signal line, suggesting bullish momentum.
- MACD Histogram: The histogram has been increasing, indicating strengthening bullish momentum.
Key Observation: The trend indicators point towards a bullish sentiment in the short term.
Momentum Indicators:
- RSI (Relative Strength Index): RSI values have been in the neutral to slightly overbought range, indicating a balanced momentum.
- Stochastic Oscillator: Both %K and %D values have been high, suggesting a bullish momentum.
- Williams %R: The Williams %R values have been close to oversold levels, indicating a potential reversal.
Key Observation: Momentum indicators show a neutral to slightly bullish sentiment.
Volatility Indicators:
- Bollinger Bands: The bands have been narrowing, indicating decreasing volatility.
- Bollinger %B: %B values have been fluctuating within a narrow range, suggesting stable volatility levels.
Key Observation: Volatility indicators signal a decreasing volatility environment.
Volume Indicators:
- On-Balance Volume (OBV): The OBV values have been mixed, indicating alternating buying and selling pressure.
- Chaikin Money Flow (CMF): CMF values have been fluctuating around the zero line, suggesting a balance between buying and selling pressure.
Key Observation: Volume indicators show a mixed sentiment with no clear direction.
Conclusion:
Based on the analysis of the technical indicators, the next few days for TMFE stock are likely to see a continuation of the bullish trend in the short term. The trend indicators support a bullish sentiment, while momentum indicators suggest a neutral to slightly bullish momentum. Volatility is expected to remain low, indicating a stable price movement environment. However, the mixed volume indicators may introduce some uncertainty in the price direction.
Overall, the outlook for TMFE stock is positive with a potential for further upside in the coming days. Investors may consider maintaining or adding to their positions based on the current technical analysis.
Key Conclusion:
- Trend: Upward
- Momentum: Neutral to slightly bullish
- Volatility: Low
- Volume: Mixed
Recommendation: Consider holding or adding to positions in TMFE stock for potential gains in the short term.