Technical Analysis of TMFG 2024-05-10
Overview:
In analyzing the technical indicators for TMFG stock over the last 5 days, we will delve into the trend, momentum, volatility, and volume indicators to provide a comprehensive outlook on the possible stock price movement in the coming days. By examining these key indicators, we aim to offer valuable insights and predictions to guide investment decisions.
Trend Analysis:
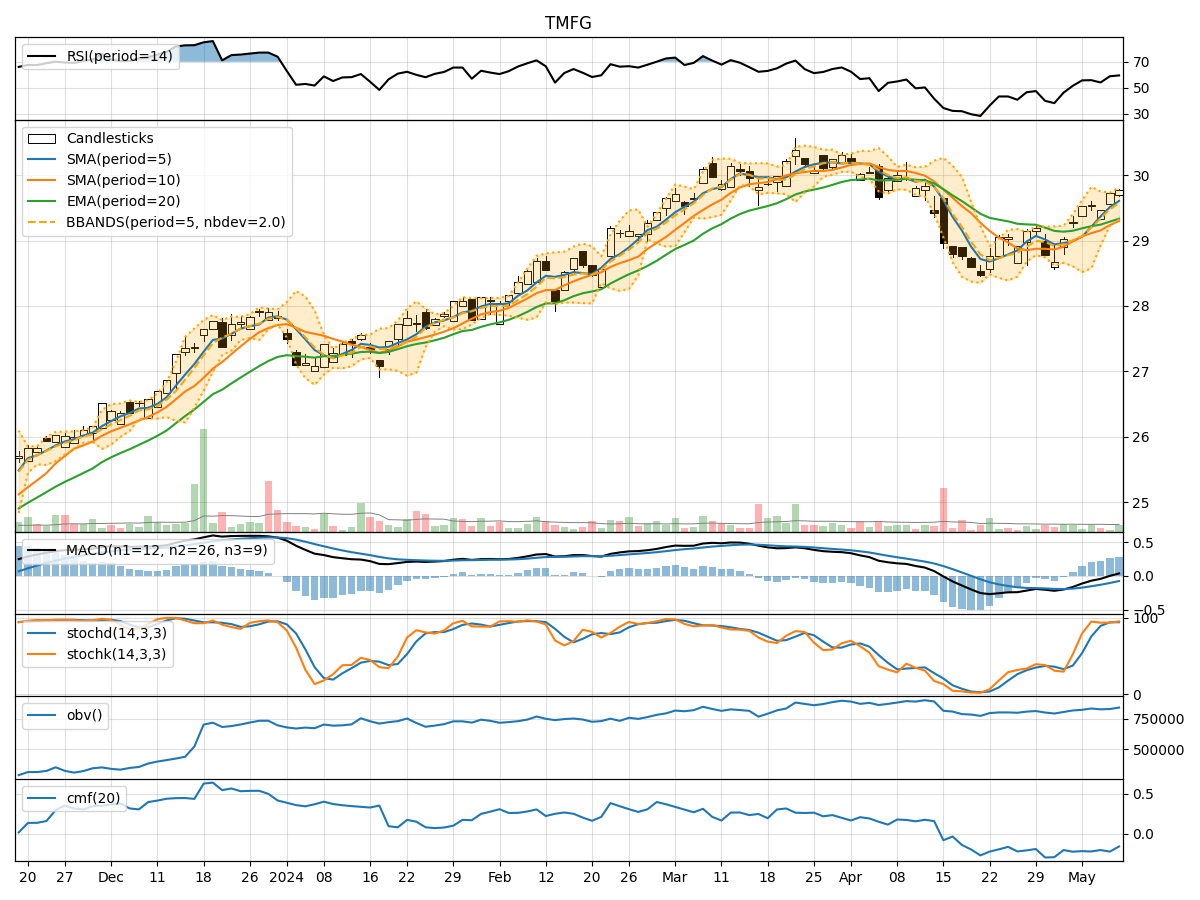
- Moving Averages (MA): The 5-day Moving Average (MA) has been consistently trending above the Simple Moving Average (SMA) and Exponential Moving Average (EMA), indicating a short-term bullish trend.
- MACD: The Moving Average Convergence Divergence (MACD) has shown positive values, with the MACD line consistently above the Signal line, suggesting bullish momentum.
- Conclusion: The trend indicators point towards an upward trend in the stock price.
Momentum Analysis:
- RSI: The Relative Strength Index (RSI) has been fluctuating around the neutral level of 50, indicating a balanced momentum in the stock.
- Stochastic Oscillator: Both %K and %D values have been in the overbought zone, suggesting a potential reversal in momentum.
- Conclusion: The momentum indicators signal a neutral stance with a slight bearish bias.
Volatility Analysis:
- Bollinger Bands: The stock price has mostly remained within the Bollinger Bands, with the bands narrowing, indicating decreasing volatility.
- Conclusion: Volatility indicators suggest a low volatility environment for the stock.
Volume Analysis:
- On-Balance Volume (OBV): The OBV has shown mixed movements, indicating indecision among market participants regarding the stock.
- Chaikin Money Flow (CMF): The CMF has been negative, reflecting selling pressure in the stock.
- Conclusion: Volume indicators point towards uncertainty in the market sentiment.
Overall Conclusion:
Based on the analysis of the technical indicators, the stock is likely to experience sideways consolidation in the coming days. The trend indicators support an upward bias, while momentum indicators suggest a neutral to slightly bearish outlook. Volatility remains low, indicating stability, but volume indicators reflect uncertainty and selling pressure.
Recommendation:
Considering the mixed signals from the technical indicators, it is advisable for investors to exercise caution and closely monitor the stock's price action. It may be prudent to wait for clearer signals or confirmation of a trend before making significant trading decisions. Additionally, keeping an eye on broader market trends and potential catalysts can provide further insights into the stock's future price movement.
In conclusion, the stock is likely to trade within a narrow range in the near term, with a potential for a breakout in either direction depending on market developments. It is essential for investors to remain vigilant and adapt their strategies accordingly to navigate the current market conditions effectively.