Technical Analysis of TMFS 2024-05-10
Overview:
In analyzing the technical indicators for TMFS over the last 5 days, we will delve into the trend, momentum, volatility, and volume indicators to provide a comprehensive outlook on the possible stock price movement in the coming days. By examining these key aspects, we aim to offer valuable insights and predictions to guide investment decisions.
Trend Indicators:
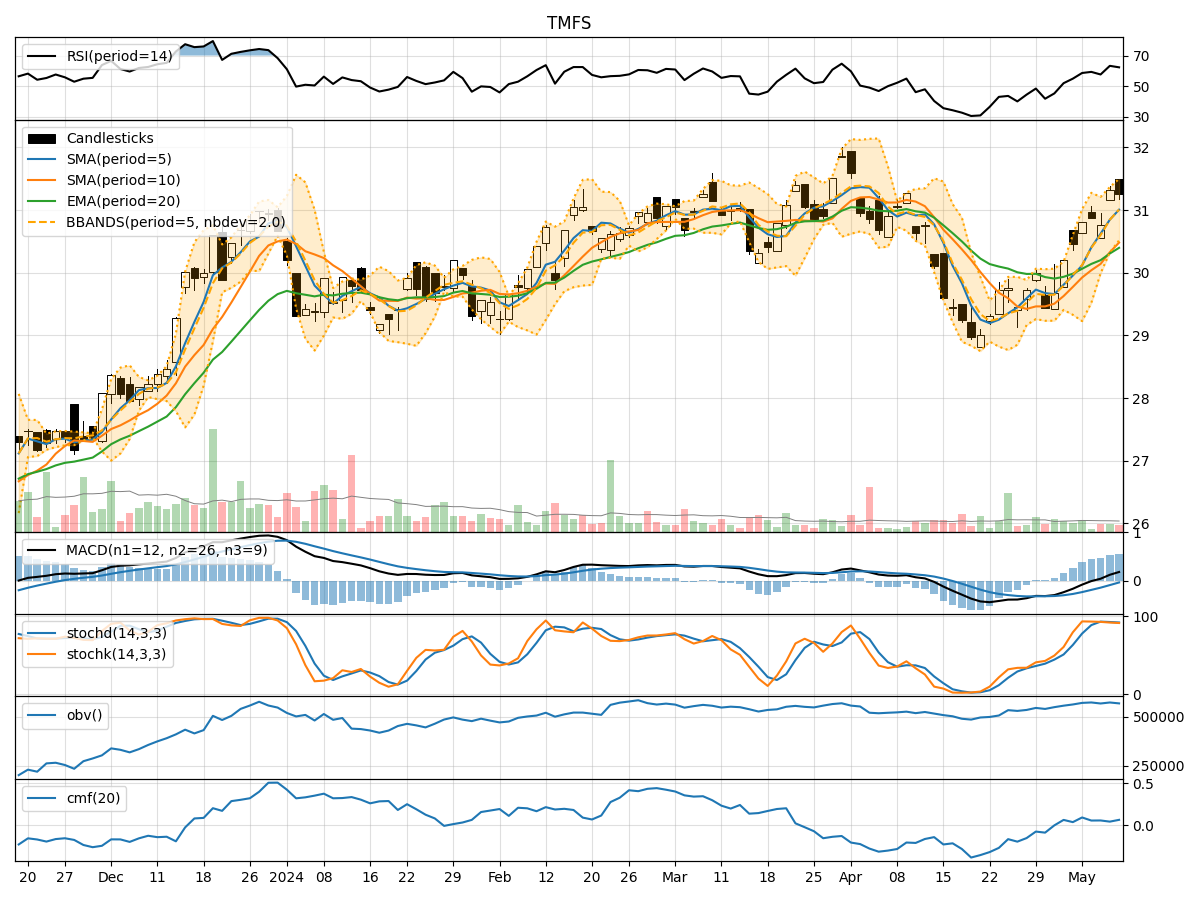
- Moving Averages (MA): The 5-day moving average has been consistently above the longer-term SMAs and EMAs, indicating a short-term uptrend.
- MACD: The MACD line has been positive and increasing, suggesting bullish momentum.
- MACD Histogram: The histogram has been rising, indicating strengthening bullish momentum.
Key Observation: The trend indicators point towards a bullish sentiment in the stock price movement.
Momentum Indicators:
- RSI: The RSI has been fluctuating around the overbought territory, indicating strong buying pressure.
- Stochastic Oscillator: Both %K and %D have been relatively high, signaling potential overbought conditions.
- Williams %R: The indicator has been hovering in the oversold region, suggesting a potential reversal.
Key Observation: Momentum indicators suggest a mixed sentiment with some signs of overbought conditions.
Volatility Indicators:
- Bollinger Bands: The stock price has been trading within the bands, indicating normal volatility.
- Bollinger %B: The %B has been fluctuating around the midline, suggesting balanced volatility.
- Average True Range (ATR): ATR values have been relatively stable, indicating consistent volatility levels.
Key Observation: Volatility indicators point towards a stable and balanced market environment.
Volume Indicators:
- On-Balance Volume (OBV): The OBV has shown slight fluctuations, indicating mixed buying and selling pressure.
- Chaikin Money Flow (CMF): The CMF has been positive but fluctuating, suggesting some uncertainty in the money flow.
Key Observation: Volume indicators reflect a neutral sentiment with no clear dominance of buying or selling pressure.
Conclusion:
Based on the analysis of trend, momentum, volatility, and volume indicators, the overall outlook for TMFS in the next few days is bullish with a potential for continued upward movement. While momentum indicators show some signs of overbought conditions, the strong trend indicators and stable volatility support a positive price trajectory. Traders should consider entering long positions with caution due to the mixed momentum signals, but the overall trend favors upward movement in the stock price.
Key Conclusion:
The technical analysis suggests a bullish view for TMFS in the next few days, with a potential for upward price movement. Investors should monitor momentum indicators closely for any signs of reversal but overall, the trend remains favorable for long positions.