Technical Analysis of TMSL 2024-05-10
Overview:
In analyzing the technical indicators for TMSL over the last 5 days, we will delve into the trend, momentum, volatility, and volume indicators to provide a comprehensive outlook on the possible stock price movement in the coming days.
Trend Analysis:
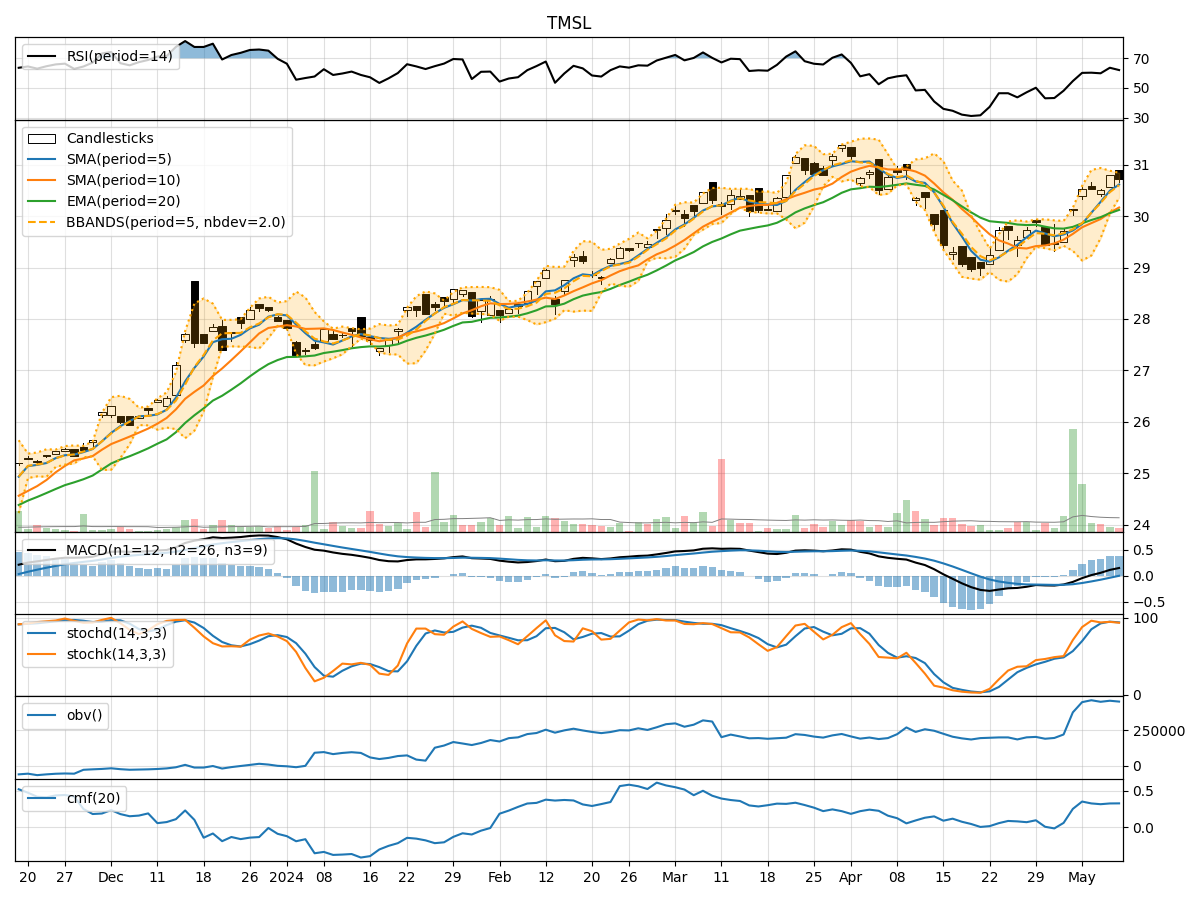
- Moving Averages (MA): The 5-day Moving Average (MA) has been consistently above the Simple Moving Average (SMA) and Exponential Moving Average (EMA), indicating a bullish trend.
- MACD: The MACD line has been consistently above the signal line, with the MACD Histogram showing positive values, suggesting a bullish momentum in the stock.
Momentum Analysis:
- RSI: The Relative Strength Index (RSI) has been hovering around the 60-63 range, indicating a neutral to slightly bullish momentum.
- Stochastic Oscillator: Both %K and %D lines of the Stochastic Oscillator have been in the overbought zone, suggesting a potential reversal or consolidation in the stock price.
- Williams %R: The Williams %R is showing oversold conditions, indicating a possible buying opportunity.
Volatility Analysis:
- Bollinger Bands: The stock price has been trading within the Bollinger Bands, with the bands narrowing, suggesting a period of low volatility and potential consolidation.
- Bollinger %B: The %B indicator is below 1, indicating that the stock price is trading below the lower Bollinger Band, signaling a possible oversold condition.
Volume Analysis:
- On-Balance Volume (OBV): The OBV has been fluctuating but showing a slight increase, indicating some accumulation in the stock.
- Chaikin Money Flow (CMF): The CMF has been positive, suggesting that money is flowing into the stock over the 20-day period.
Conclusion:
Based on the analysis of the technical indicators: - The stock is currently in a bullish trend as indicated by the moving averages and MACD. - Momentum indicators suggest a neutral to slightly bullish sentiment in the short term. - Volatility indicators point towards a period of consolidation with low volatility. - Volume indicators show some accumulation in the stock.
Forecast:
Considering the overall analysis, the next few days may see the stock price consolidating within a narrow range before potentially resuming its upward trend. Traders should watch for a breakout above the recent highs for a confirmation of further bullish momentum. Additionally, keeping an eye on the Stochastic Oscillator for a potential reversal signal would be prudent.