Technical Analysis of TOK 2024-05-10
Overview:
In analyzing the technical indicators for TOK stock over the last 5 days, we will delve into the trend, momentum, volatility, and volume indicators to provide a comprehensive outlook on the possible stock price movement in the coming days.
Trend Indicators:
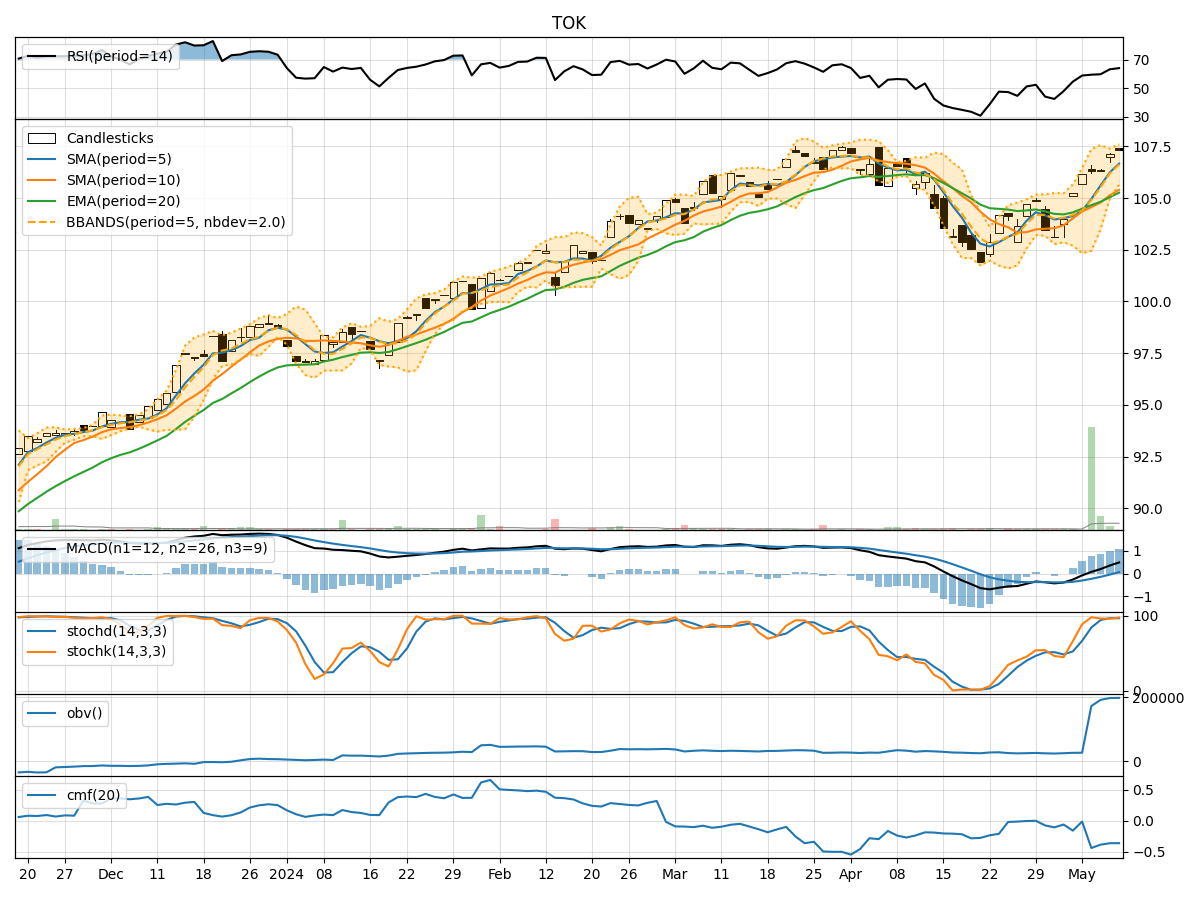
- Moving Averages (MA): The 5-day Moving Average has been consistently above the Simple Moving Average (SMA) and Exponential Moving Average (EMA), indicating a bullish trend.
- MACD: The MACD line has been consistently above the signal line, with both lines showing an upward trend, suggesting bullish momentum.
- MACD Histogram: The MACD Histogram has been increasing over the past 5 days, indicating strengthening bullish momentum.
Momentum Indicators:
- RSI: The Relative Strength Index (RSI) has been trending upwards and is currently in the overbought territory, suggesting a strong bullish momentum.
- Stochastic Oscillator: Both %K and %D lines of the Stochastic Oscillator have been in the overbought zone, indicating a strong bullish momentum.
- Williams %R: The Williams %R is also in the overbought region, further supporting the bullish sentiment.
Volatility Indicators:
- Bollinger Bands: The price has been consistently trading above the middle Bollinger Band (BBM), indicating an upward trend. The bands are relatively narrow, suggesting low volatility.
- Bollinger %B: The %B indicator is above 0.5, indicating that the price is closer to the upper Bollinger Band, signaling a bullish trend.
Volume Indicators:
- On-Balance Volume (OBV): The OBV has been steadily increasing over the last 5 days, indicating strong buying pressure.
- Chaikin Money Flow (CMF): The CMF has been negative but improving, suggesting a potential shift towards buying pressure.
Conclusion:
Based on the analysis of the technical indicators, the TOK stock is exhibiting strong bullish signals across trend, momentum, volatility, and volume indicators. The moving averages, MACD, RSI, Stochastic Oscillator, and OBV all point towards a continuation of the upward trend in the stock price. The low volatility and the position of the price relative to the Bollinger Bands further support the bullish outlook.