Technical Analysis of TOLL 2024-05-10
Overview:
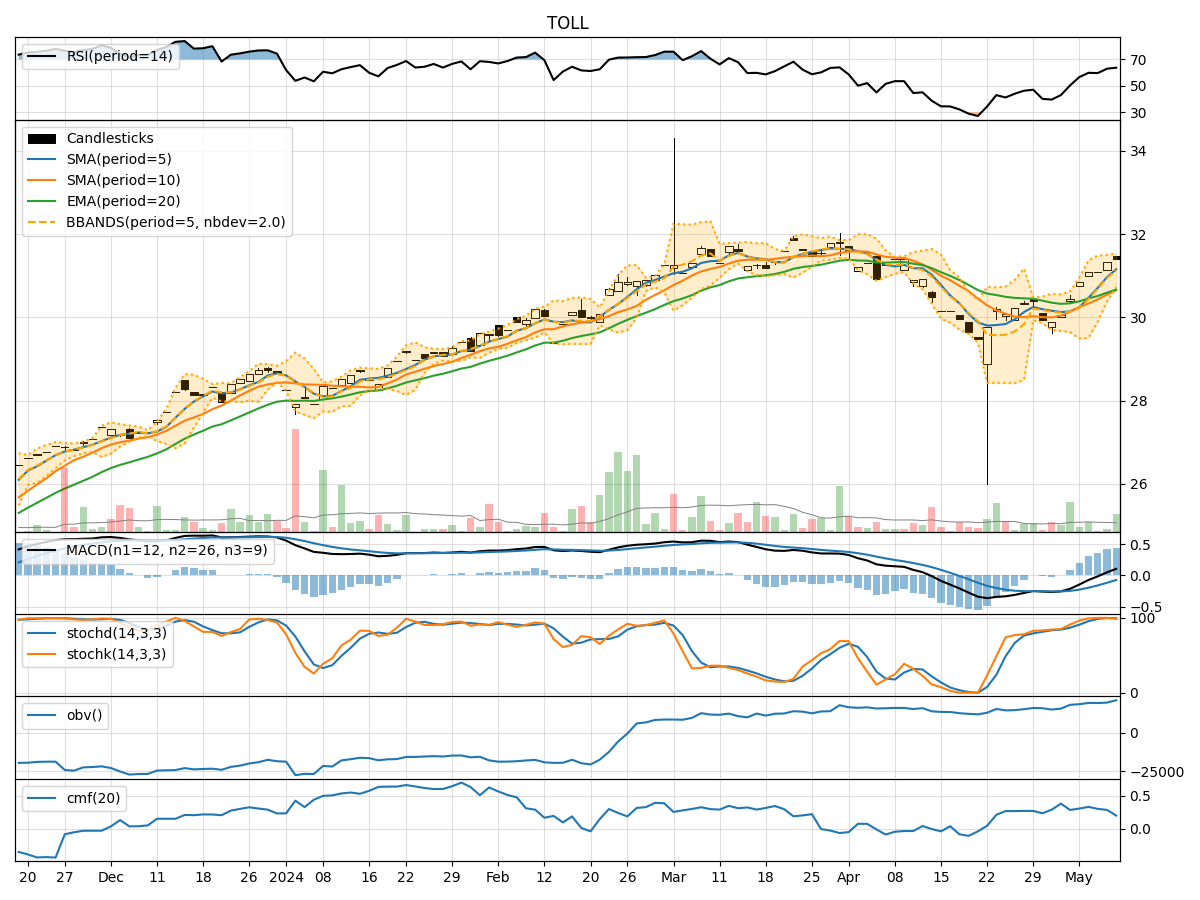
In the last 5 trading days, TOLL stock has shown a consistent uptrend in both price and volume. The moving averages have been trending upwards, indicating a bullish sentiment. Momentum indicators like RSI and Stochastic oscillators suggest the stock is in overbought territory. Volatility indicators show a narrowing of the Bollinger Bands, indicating a potential decrease in volatility. Volume indicators also show a positive trend, with On-Balance Volume (OBV) increasing steadily.
Trend Analysis:
- Moving averages (MA) have been on an upward trajectory, with the 5-day MA consistently above the 10-day SMA, indicating a bullish trend.
- Exponential Moving Average (EMA) has been rising steadily, supporting the bullish sentiment.
- MACD line has been above the signal line, with both lines trending upwards, indicating a strengthening bullish momentum.
Momentum Analysis:
- RSI has been increasing, reaching overbought levels above 70, suggesting a potential pullback or consolidation in the near future.
- Stochastic oscillators are also in the overbought zone, indicating a possible reversal or correction.
- Williams %R (WillR) is showing oversold conditions, which could signal a short-term bearish reversal.
Volatility Analysis:
- Bollinger Bands are narrowing, indicating a decrease in volatility and a potential period of consolidation or sideways movement.
- The Bollinger Band %B indicator is above 0.5, suggesting the stock is trading above the mid-band, indicating bullish momentum.
- Bollinger Band Width is decreasing, indicating a potential decrease in price fluctuations.
Volume Analysis:
- On-Balance Volume (OBV) has been steadily increasing, indicating strong buying pressure and accumulation of the stock.
- Chaikin Money Flow (CMF) is positive, indicating that money is flowing into the stock over the past 20 days.
Conclusion:
Based on the technical indicators analyzed: - Trend: The stock is in a strong upward trend. - Momentum: The stock is overbought and may experience a short-term pullback or consolidation. - Volatility: Volatility is decreasing, suggesting a potential period of consolidation or sideways movement. - Volume: Strong buying pressure is indicated by increasing OBV and positive CMF.
Forecast:
Given the current technical indicators, the next few days for TOLL stock are likely to see a short-term pullback or consolidation due to overbought conditions in momentum indicators. However, the overall trend remains bullish, and any pullback could present a buying opportunity for investors looking to enter or add to their positions in the stock. It is essential to monitor price action closely for any signs of reversal or continuation of the current trend.