Technical Analysis of TOLZ 2024-05-10
Overview:
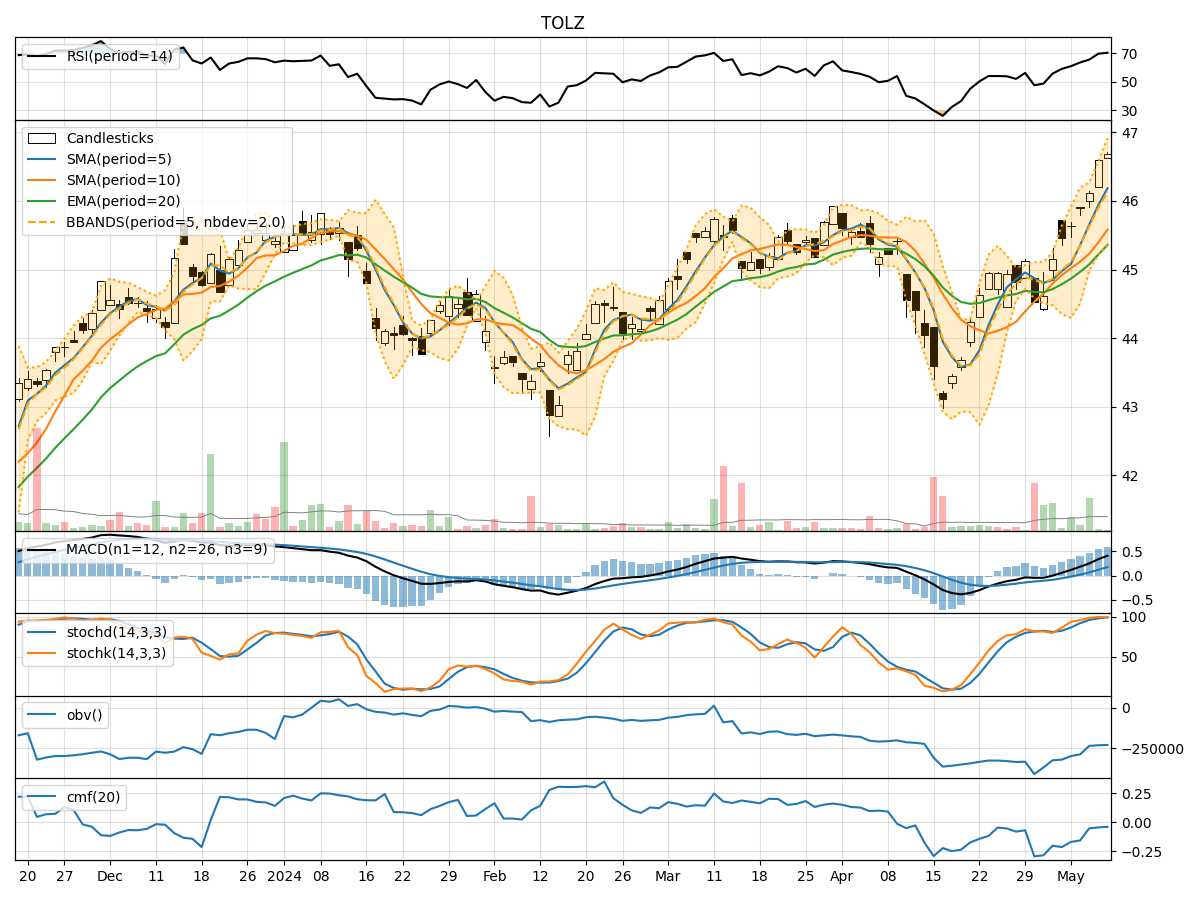
In analyzing the technical indicators for TOLZ over the last 5 days, we will delve into the trend, momentum, volatility, and volume indicators to provide a comprehensive outlook on the possible stock price movement in the coming days. By examining these key aspects, we aim to offer valuable insights and predictions to guide your investment decisions.
Trend Analysis:
- Moving Averages (MA): The 5-day Moving Average (MA) has been consistently above the Simple Moving Average (SMA) and Exponential Moving Average (EMA), indicating a bullish trend.
- MACD: The MACD line has been consistently above the signal line, with both lines showing an upward trend, suggesting bullish momentum.
Momentum Analysis:
- RSI: The Relative Strength Index (RSI) has been trending upwards and is currently in the overbought territory, indicating a strong bullish momentum.
- Stochastic Oscillator: Both %K and %D lines of the Stochastic Oscillator are in the overbought zone, suggesting a potential reversal or consolidation.
Volatility Analysis:
- Bollinger Bands: The stock price has been consistently trading above the middle Bollinger Band (BBM), indicating an uptrend. The bands are relatively narrow, suggesting low volatility.
Volume Analysis:
- On-Balance Volume (OBV): The OBV has been declining over the last 5 days, indicating a divergence between price and volume, which could signal a potential reversal.
- Chaikin Money Flow (CMF): The CMF has been negative, indicating selling pressure in the stock.
Key Observations:
- The trend indicators suggest a strong bullish sentiment in the short term.
- Momentum indicators show overbought conditions, which may lead to a potential pullback or consolidation.
- Volatility is relatively low, indicating a stable price movement.
- Volume indicators signal a divergence between price and volume, which could hint at a reversal in the stock price.
Conclusion:
Based on the analysis of the technical indicators, the stock price of TOLZ is likely to experience a short-term upward movement in the next few days. However, given the overbought conditions in the momentum indicators and the divergence in volume, there is a possibility of a temporary pullback or consolidation before resuming the uptrend. Traders should closely monitor key support and resistance levels for potential entry or exit points.
Recommendation:
- Short-term Traders: Consider taking profits or tightening stop-loss levels to manage potential downside risks.
- Long-term Investors: Monitor the price action for a potential entry point during a pullback to benefit from the overall bullish trend.
Always remember to conduct further research and consider other fundamental factors before making any investment decisions.