Technical Analysis of TOTR 2024-05-10
Overview:
In analyzing the technical indicators for TOTR over the last 5 days, we will delve into the trends, momentum, volatility, and volume indicators to provide a comprehensive outlook on the possible stock price movement. By examining these key aspects, we aim to offer valuable insights and predictions for the upcoming days.
Trend Indicators:
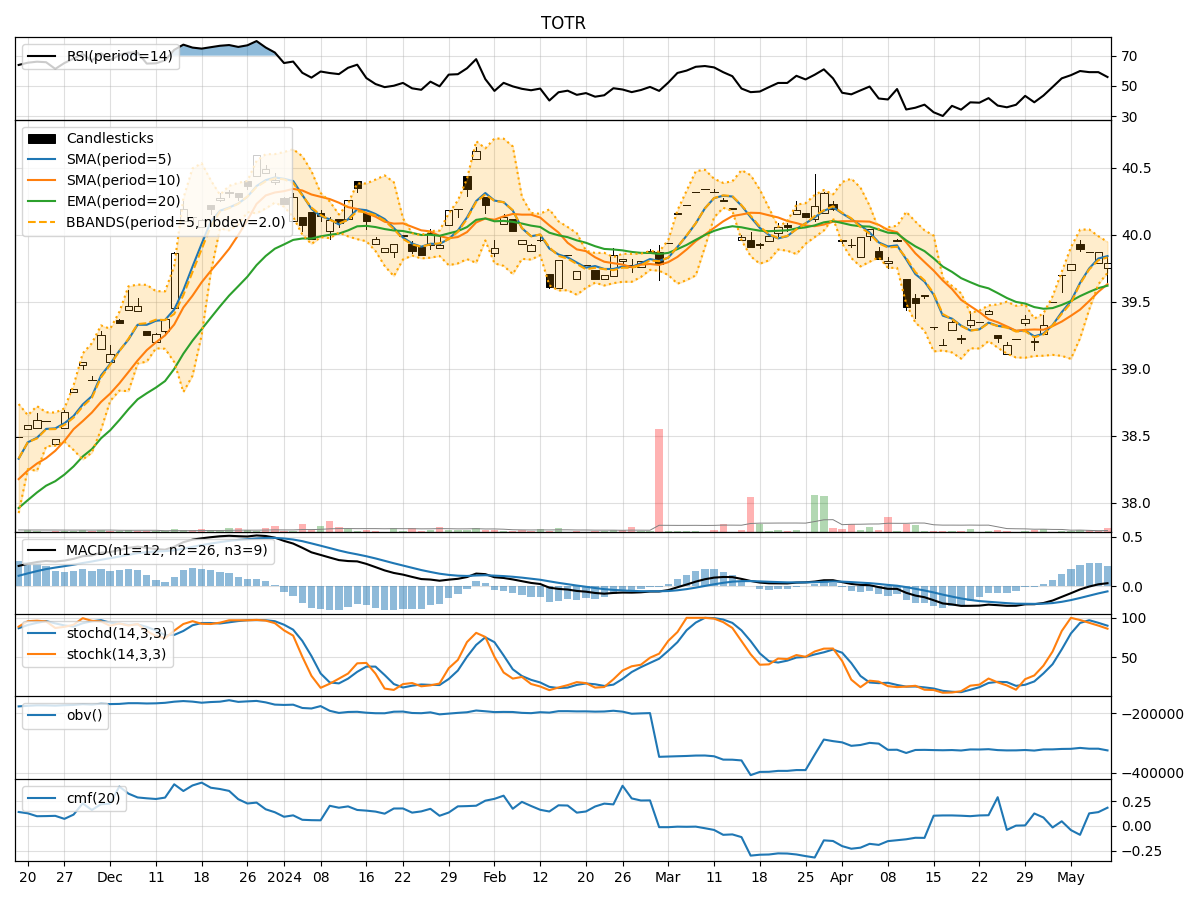
- Moving Averages (MA): The 5-day MA has been consistently above the closing price, indicating a short-term uptrend.
- MACD: The MACD line has been positive, suggesting bullish momentum.
- RSI: The RSI has been in the neutral to slightly overbought territory, indicating potential strength in the current trend.
Momentum Indicators:
- Stochastic Oscillator: The Stochastic Oscillator has been in the overbought zone, signaling a potential reversal or consolidation.
- Williams %R (WillR): The Williams %R has been in the oversold territory, indicating a possible buying opportunity.
Volatility Indicators:
- Bollinger Bands (BB): The narrowing of the Bollinger Bands suggests decreasing volatility and a potential breakout in the near future.
- Average True Range (ATR): A low ATR indicates reduced volatility and possibly a period of consolidation.
Volume Indicators:
- On-Balance Volume (OBV): The OBV has been fluctuating, indicating indecision among market participants.
- Chaikin Money Flow (CMF): The CMF has shown positive values, suggesting buying pressure in the market.
Key Observations and Opinions:
- Trend: The trend indicators point towards a bullish sentiment in the short term.
- Momentum: Mixed signals from the momentum indicators suggest a possible reversal or consolidation.
- Volatility: Decreasing volatility may precede a significant price movement.
- Volume: The volume indicators reflect uncertainty in the market sentiment.
Conclusion:
Based on the analysis of the technical indicators, the next few days' possible stock price movement for TOTR could be sideways consolidation with a slight upward bias. Traders should closely monitor the Stochastic Oscillator for potential reversal signals and the Bollinger Bands for a breakout confirmation. Additionally, keeping an eye on the OBV and CMF for any shifts in buying pressure is crucial. Overall, a cautious approach with a focus on key support and resistance levels is recommended in the current market environment.